Revenue operations
Step-by-step guide to crafting impactful sales reports (with examples)

Jonathan Costet
Content Author
Published on: August 22, 2022
Last modified on: March 4, 2026
How do you know who’s meeting their quotas and who’s falling short? Do you have enough opportunities in your pipeline to meet your targets this quarter? What’s your win rate? And how is it trending over time?
Answering these questions is key to growing your revenue. But without the right data, you’ll be left in the dark about what’s really happening.
This is why sales reports are so important. They help you measure your sales performance and deliver insights that you can leverage to optimize your sales process.
In this guide, we’ll look at why you should create a sales report and what metrics you should include. We’ll also cover the steps to creating an effective sales report that offers insights you can leverage to boost your bottom line.
What is a sales report?
A sales report, also known as a sales analysis report, provides a summary of the sales activities within your company. It includes a complete breakdown of sales metrics like new revenue, participation rates, win rates, and more.
Think of a sales report as a navigation tool. It shows you where you are and provides insights that you can leverage to “steer” your team in the right direction.
Why should you create a sales report?
As a sales leader, you’re responsible for managing your sales team and assessing their progress. However, monitoring sales activities for your entire team isn’t easy.
Here’s why you should create a sales report (if you haven’t already).
Measure sales performance
Unless you measure something, you won’t know whether you’re improving.
A sales report helps you understand which aspects of your sales strategy are working and which ones need adjustment. It also lets you track and monitor the performance of each sales rep.
A sales report can help you get to the root cause of any performance issues. For example, a dip in conversion rates affects your bottom line. But is it because of low-performing hires or a sales process issue? Digging into your data can help you find out.
Improve your sales prospecting
Targeting the right prospects is key to closing more deals. A sales report can help improve your sales prospecting by identifying the characteristics behind opportunities that closed.
For example, let’s say your data shows that a certain industry responds well to your products or services. With these insights, your team can prioritize prospects from that industry and increase their win rates.
Forecast revenue more accurately
Accurate forecasts are essential for allocating resources and managing cash flow. They help you make informed decisions like whether to invest in additional staff or buy more inventory.
Forecasts can also help you align sales quotas and revenue expectations. For example, if a sales report from the previous year shows slowdowns, you can anticipate a similar drop in the same timeframe and work on remediation plans.
Build a winning sales plan
Finally, a sales report can help you build a more effective sales plan — a document that lays out your revenue goals and the steps you’ll take to meet them. If a particular strategy isn’t working out, you can adjust your sales plan and communicate those changes to your team.
In short, a sales report can help you measure sales performance, identify areas of improvement, and provide a more strategic direction for your team.
What should you include in your sales report?
To create an effective sales report, you need to track the right key performance indicators (KPIs). Here are the most important metrics that you should track.
Revenue metrics
Tracking revenue or the amount of sales you generate helps you measure financial performance. An increase in revenue is always a positive sign.
Revenue metrics to track include:
- Pipeline: Pipeline refers to the number of opportunities that you have in your sales pipeline and their estimated value. If you have 10 opportunities in your pipeline and they’re valued at $50,000, the value of your pipeline is $500,000.
- Pipeline coverage:Pipeline coverage is the ratio of the total value in your pipeline to your revenue target. If the value of your pipeline is $150,000 and you have a target of $100,000, then your pipeline coverage is 1.5x (150,000 / 100,000). A good rule of thumb is to have a 3x pipeline coverage ratio.
- Quota attainment:Quota attainment measures a rep’s total sales as a percentage against their quota within a specific period. It’s a clear indicator of whether you’re setting the right sales goals.
- Participation rate:Participation rate is the percentage of sales reps who are at or above their targets. If 4 reps out of a team of 10 are hitting their targets, then your participation rate is 40%. Sales leaders must aim for a 70% participation rate to reach their sales goals.
- Sales leaderboard:A sales leaderboard is a tool that lets you track your sales team’s performance against business goals. It can help you see who’s ahead of their targets and who’s behind.
Activity metrics
Activity metrics refer to the behaviors of your sales team. If a rep isn’t meeting their sales goals, you can dig into their activity metrics to determine why.

Activity metrics to track include:
- Calls and emails: Cold calling and sending emails are effective ways to reach your prospects. They can also be used to improve your sales training. For example, if you know which calls generated sales, you can try to replicate them.
- Meetings booked:Meetings are an important milestone in the sales process. Tracking the number of meetings booked can tell you how effective reps are at getting prospects interested.
- Conversion rates between sales stages:Stage conversion rate is the percentage of opportunities that move from one stage to the next. Tracking this metric can highlight the areas in your sales process that need work.
- Win rates:Win rates are the percentage of deals that a sales rep closes. To calculate win rates, you divide the number of closed-won deals by all sales opportunities.
Forecast metrics
Forecasting helps with resource allocation and financial planning. Tracking the right metrics can help you forecast more accurately.
Forecast metrics to track include:
- Current forecast:Current forecast is a projection of how much revenue you expect your team to bring in within a specific timeframe.
- Pipeline by forecast category:Forecast categories enable you to classify opportunities based on where they are in the sales process and how likely they are to convert. This metric can help you make more accurate forecasts.
Tracking these metrics on a regular basis enables you to measure your sales team’s performance. It also provides more insights into how effective your sales process is.
Looking for a better way to forecast revenue? Get complete visibility into your pipeline and forecast with confidence with our sales forecasting software .
How to create a sales report that delivers powerful insights
Creating a sales report can be challenging. Fortunately, we broke down the process into bite-sized steps that you can follow.
Follow these steps to create an effective sales report.
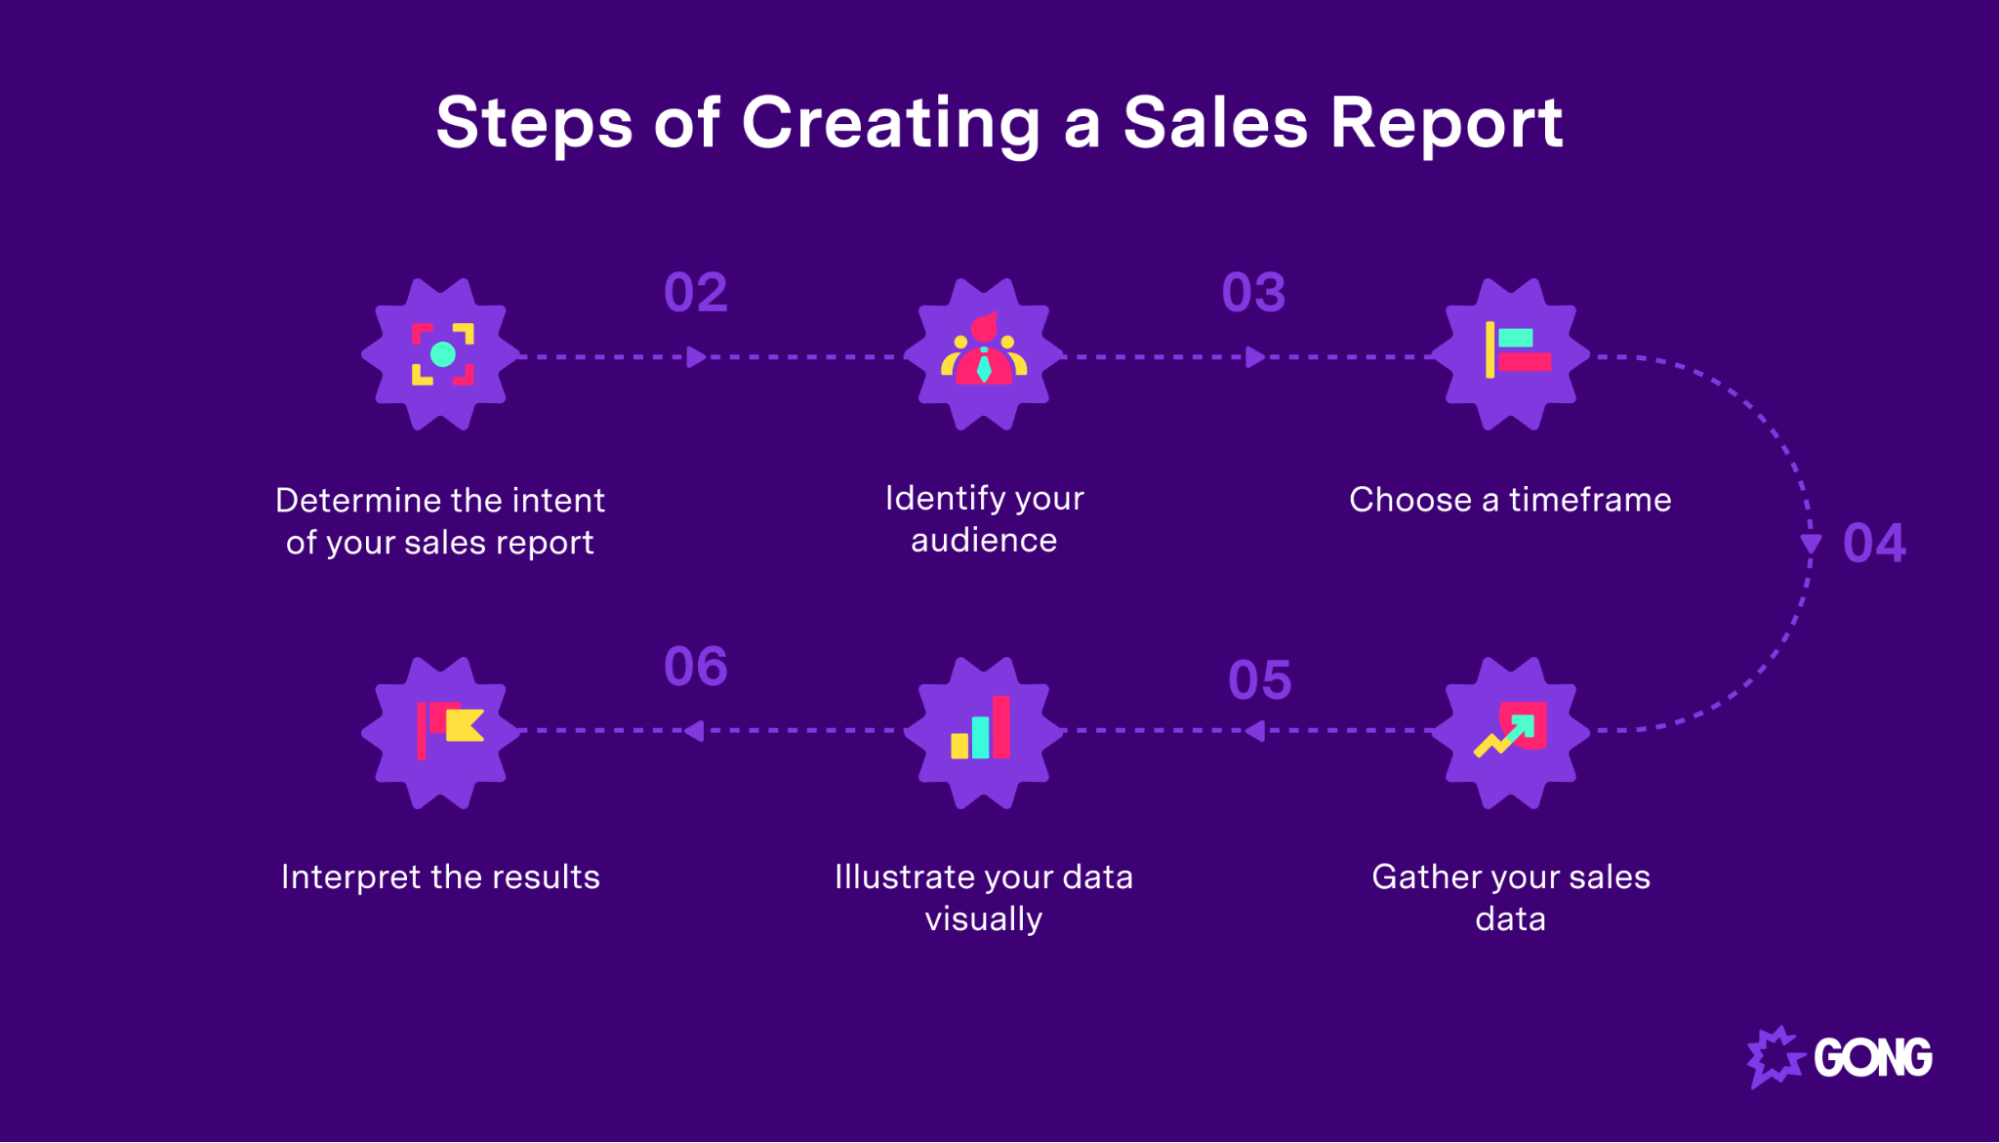
1. Determine the intent of your sales report
The first step to creating a sales report is to identify its purpose.
Why are you putting together a sales report in the first place? Are you looking to measure your team’s performance? Or are you looking to identify areas of improvement?
The answers to these questions will ensure that you’re gathering the right data instead of just throwing everything on one page. It’ll also provide a clear direction for your sales report.
For example, let’s say you want to improve your sales prospecting. In this case, you’gather information about closed-won deals. Then you might gather activity metrics for each rep to identify any trends.
2. Identify your audience
As a sales leader, you’re likely sitting on a mountain of information. While that data might be relevant for you, is it useful for the rest of the team? Probably not.
Before you create your sales report, it’s important to considerwhoit’s for.

For example, a sales manager will want a sales report with a full breakdown for each rep — opportunities in their pipeline, a summary of their activities, etc. In contrast, a Chief Financial Officer (CFO) will likely find sales forecasts more useful for financial planning and budgeting purposes.
Define who you’re creating a sales report for. This will ensure that you’re showing only the most relevant information.
3. Choose a timeframe
Once you determine the intent and purpose of your sales report, the next step is to decide on the period of time that you want to cover.
Common timeframes include:
- Daily sales reports:A daily sales report will report on the daily activities of your sales team. It’ll focus on metrics like the number of calls made, the number of meetings booked, and the number of opportunities created. Daily reports typically don’t include outcome metrics like average deal sizes.
- Weekly sales reports:A weekly sales report is a great way to gauge progress for a given week against a goal. These reports typically include metrics like the number of meetings booked, lead response times, and total pipeline coverage.
- Quarterly sales reports: A monthly sales report will focus more on the “bigger picture.” it typically includes more long-term sales KPIs like the number of won deals, total sales revenue, sales cycle length, and conversion rates.
Choose a timeframe that suits your purposes. If you’re just putting together a daily sales activity report, then you don’t want to include anything outside that timeframe.
4. Gather your sales data
To create an effective sales report, you need the right data. However, you’ll need to get this set up early on. For example, if you’re planning to track activity metrics like the number of calls that reps make, you’ll need a way to record these figures.
While you can use a spreadsheet, using Customer Relationship Management (CRM) software is more practical. This will help users track their sales activities, which will make it easier for you to gather the data you need.
Alternatively, you can also use sales tracking software like Gong to track activity metrics for each rep and gather data on customer touchpoints throughout a deal.
No matter what tools you use to gather your data, make sure to only include relevant data for your intended audience. Cut out any fluff, so they can focus on what’s important.
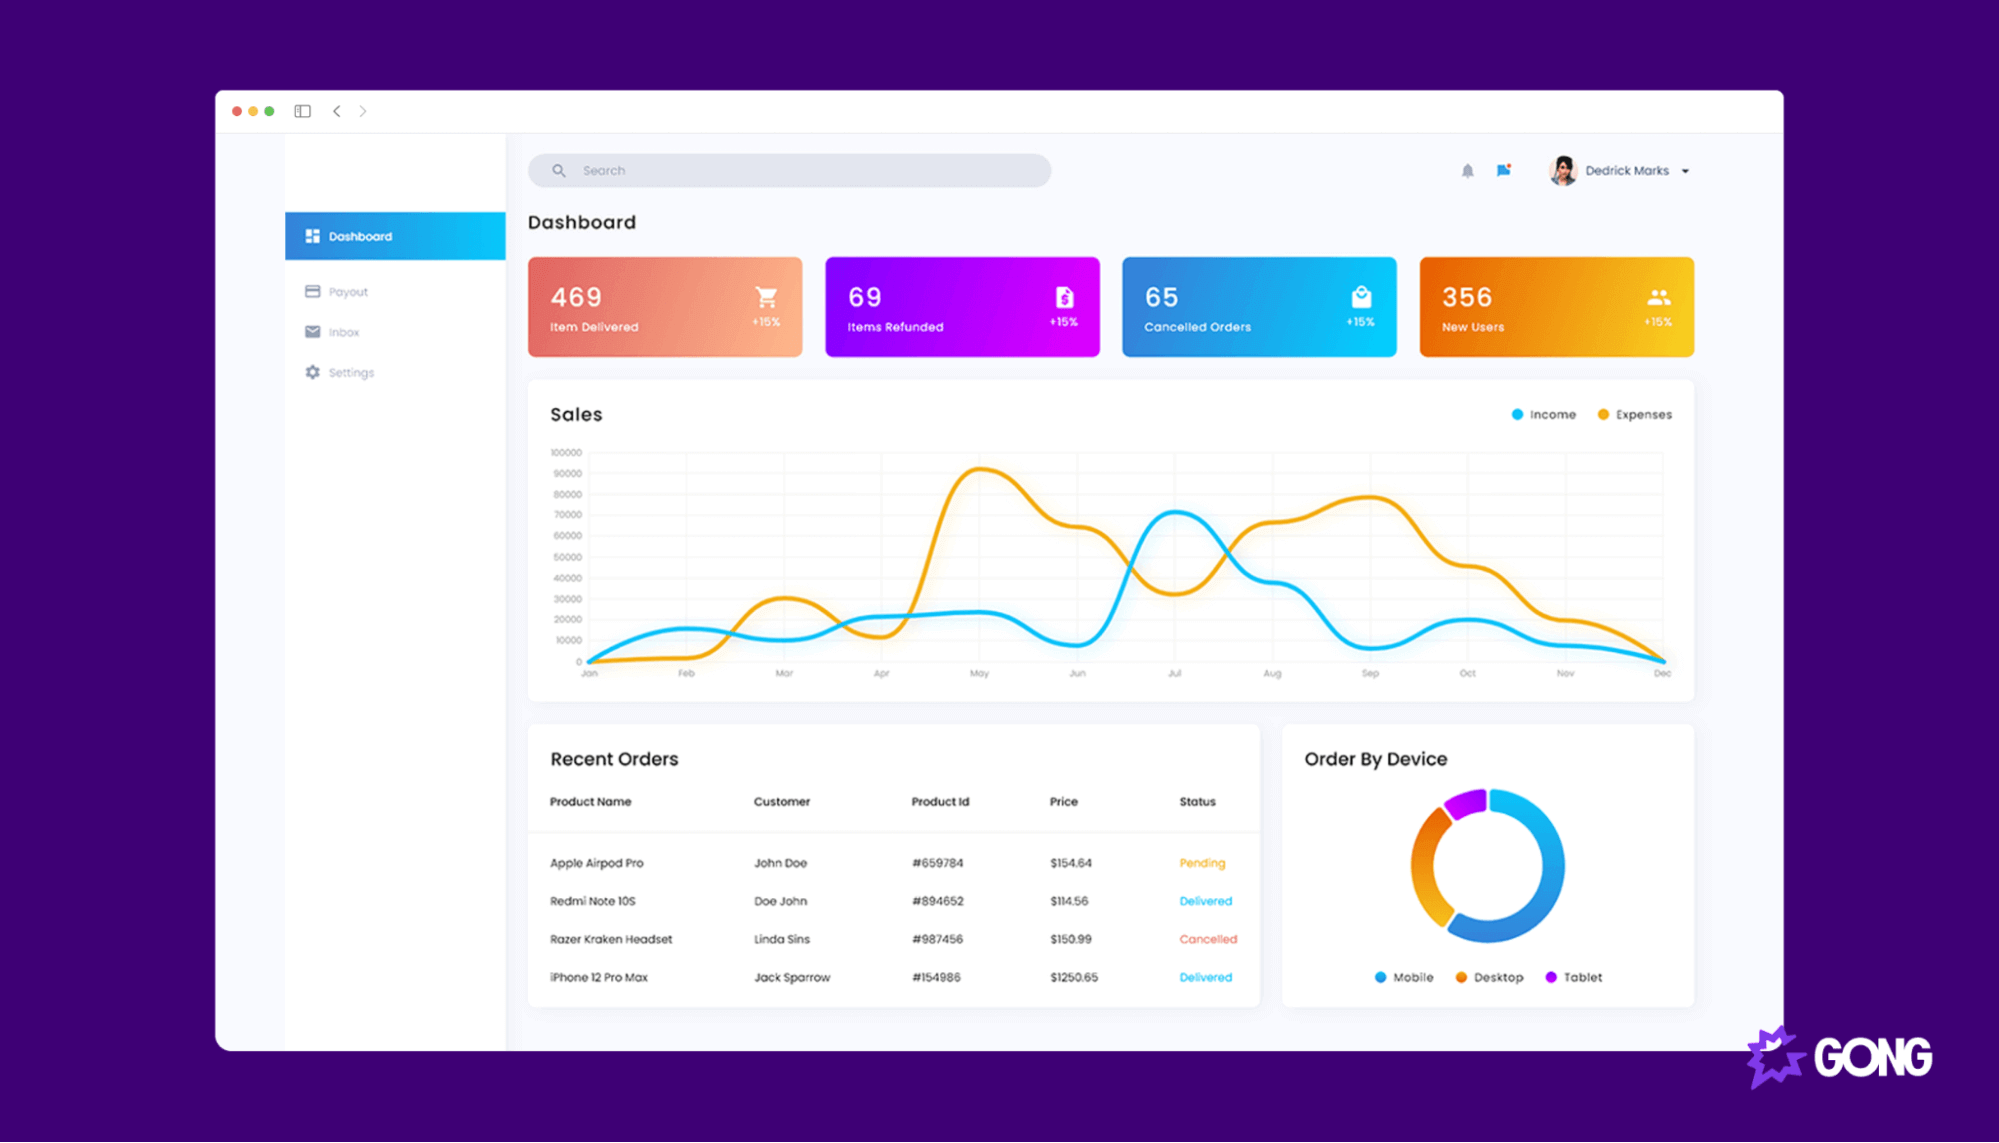
5. Illustrate your data visually
Rather than expecting your manager to go through tables of numbers, visualize your data with charts, graphs, and tables. This will make the data much easier to understand.

For example, you might use line graphs to show how revenue is trending upwards or downwards. Let’s say you want to show the total value of deals for each source. Instead of using a table, you might use a pie chart to show the data more clearly.
Choose a data visualization that works with your data set. It should highlight important trends and help your audience quickly get the information they need.
6. Interpret the results
Don’t make any assumptions here. Whether you’re creating a sales report for a senior executive or a department head, they want to know the significance of the data you’re presenting.
Include a few key takeaways with your report to contextualize the data. You might also include your own interpretation along with any recommendations (if relevant).
For example, if there’s a sudden uptick in sales, don’t just highlight that in your report. Try to figure out what your team did differently during that period. Did they implement a new sales methodology ? Did the marketing team change how they qualify leads?
Analyze the data you have available and include that in your sales report. This will provide more insights to whoever is reading it and help them make informed business decisions.
Track your team’s performance with our sales report template
If you’re looking for an easy way to track your sales team’s performance, we’ve got you covered. Our free sales report template lets you create:
- Activity reports:Track activity metrics for your entire team like number of calls made, number of meetings booked, and more.
- Pipeline reports:Create weekly reports on your weekly coverage and calculate how much pipeline each rep needs to close the gap.
- Leaderboards:Automatically create a sales leaderboard for activity and pipeline metrics. See who’s meeting their targets and who’s falling behind.
The sales report template couldn’t be easier to use — simply enter each rep’s weekly stats, and the template will automatically highlight key metrics, so you can see what’s working (and what’s not).
Click here to get the free sales report template .
Conclusion
A sales report is a crucial tool that helps you monitor and evaluate your team’s performance. It also provides key insights into what areas of your sales strategy are working and what needs more work.
Follow the steps laid out above to create an effective sales report — determine its purpose and audience, choose a timeframe, gather your sales data, use the right visuals, and contextualize your findings.
Looking to unlock more revenue from your pipeline and exceed your growth goals?
With Gong’s sales software , you get complete visibility into all your deals. Make accurate forecasts, see which deals are at risk of slipping, prioritize high-value clients, and more. The software also integrates with your CRM so you can tie all interactions with your existing customer records.
Content Author
Jonathan Costet is the Senior Director of Revenue Marketing at Wiz. Before this, he was Senior Manager, Growth Marketing at Gong, where he played a crucial role in driving demand generation through data-driven strategies. At Gong, Jonathan harnessed the power of revenue intelligence to craft effective messaging, improve customer retention, and optimize sales forecasting. He was instrumental in using Gong's platform to unlock insights that helped target the right buyers and maximize marketing efficiency.
Win more with Gong
Loading form...
Discover more from Gong
Check out the latest product information, executive insights, and selling tips and tricks, all on the Gong blog.