Sales strategies
13 sales KPIs to measure team performance

Jonathan Costet
Content Author
Published on: September 21, 2022
Last modified on: March 4, 2026
Tracking sales performance is theonlyway to know how well you and your team are doing.
But the thing is, simply asking, “how much did we sell this month?” isn’t enough.
Many aspects influence revenue growth – average sales cycle length , churn rate, and customer acquisition cost, to name just a few.
So, to gain a 360-degree view of your sales teams’ performance, you need to track KPIs in each area, measuring team and individual performance beyond just the topline.
This guide will explore 13 essential sales KPIs to track, measure, and report your sales efforts.
What are sales KPIs?
First, let’s break down that acronym (boy, we love our acronyms in sales, don’t we?)
KPI stands for Key Performance Indicator. A sales KPI is any metric or measurement that tells you whether a team or individual is performing as expected.
Good sales KPIs consist of two components: the measurement itself and the performance expectation.
Sales revenue is a classic example of a key performance indicator, but measuring revenue as it stands isn’t sufficient: we need a benchmark.
Saying that your team achieved $500k revenue in month one against a target of $2m for the quarter tells you that there are chances of missing the target, and hence you can make timely interventions. This is much more powerful than simply saying your team closed $500k in sales.
In short, sales KPIs help us understand if we’re doing a good job. Of course, we can measure this in many ways, which is why we’re going to explore 10 of the most important KPIs for your sales teams to measure.
10 most critical sales KPIs to measure
Today’s sales tools make tracking your sales process easy. We can set up dashboards to see progress in real-time , and we can measure just about anything.
But that doesn’t mean we should measureeverything.
A good rule of thumb is to track only those KPIs that are important to your current business goals.
For instance, Average Customer Value is a great KPI in general, but if you’re an early-stage startup focused more on new customer acquisition than revenue from each current customer, then this wouldn’t be an appropriate KPI for the sales manager.
Keep your team focused by choosing only those KPIs that are most relevant to your own objectives.
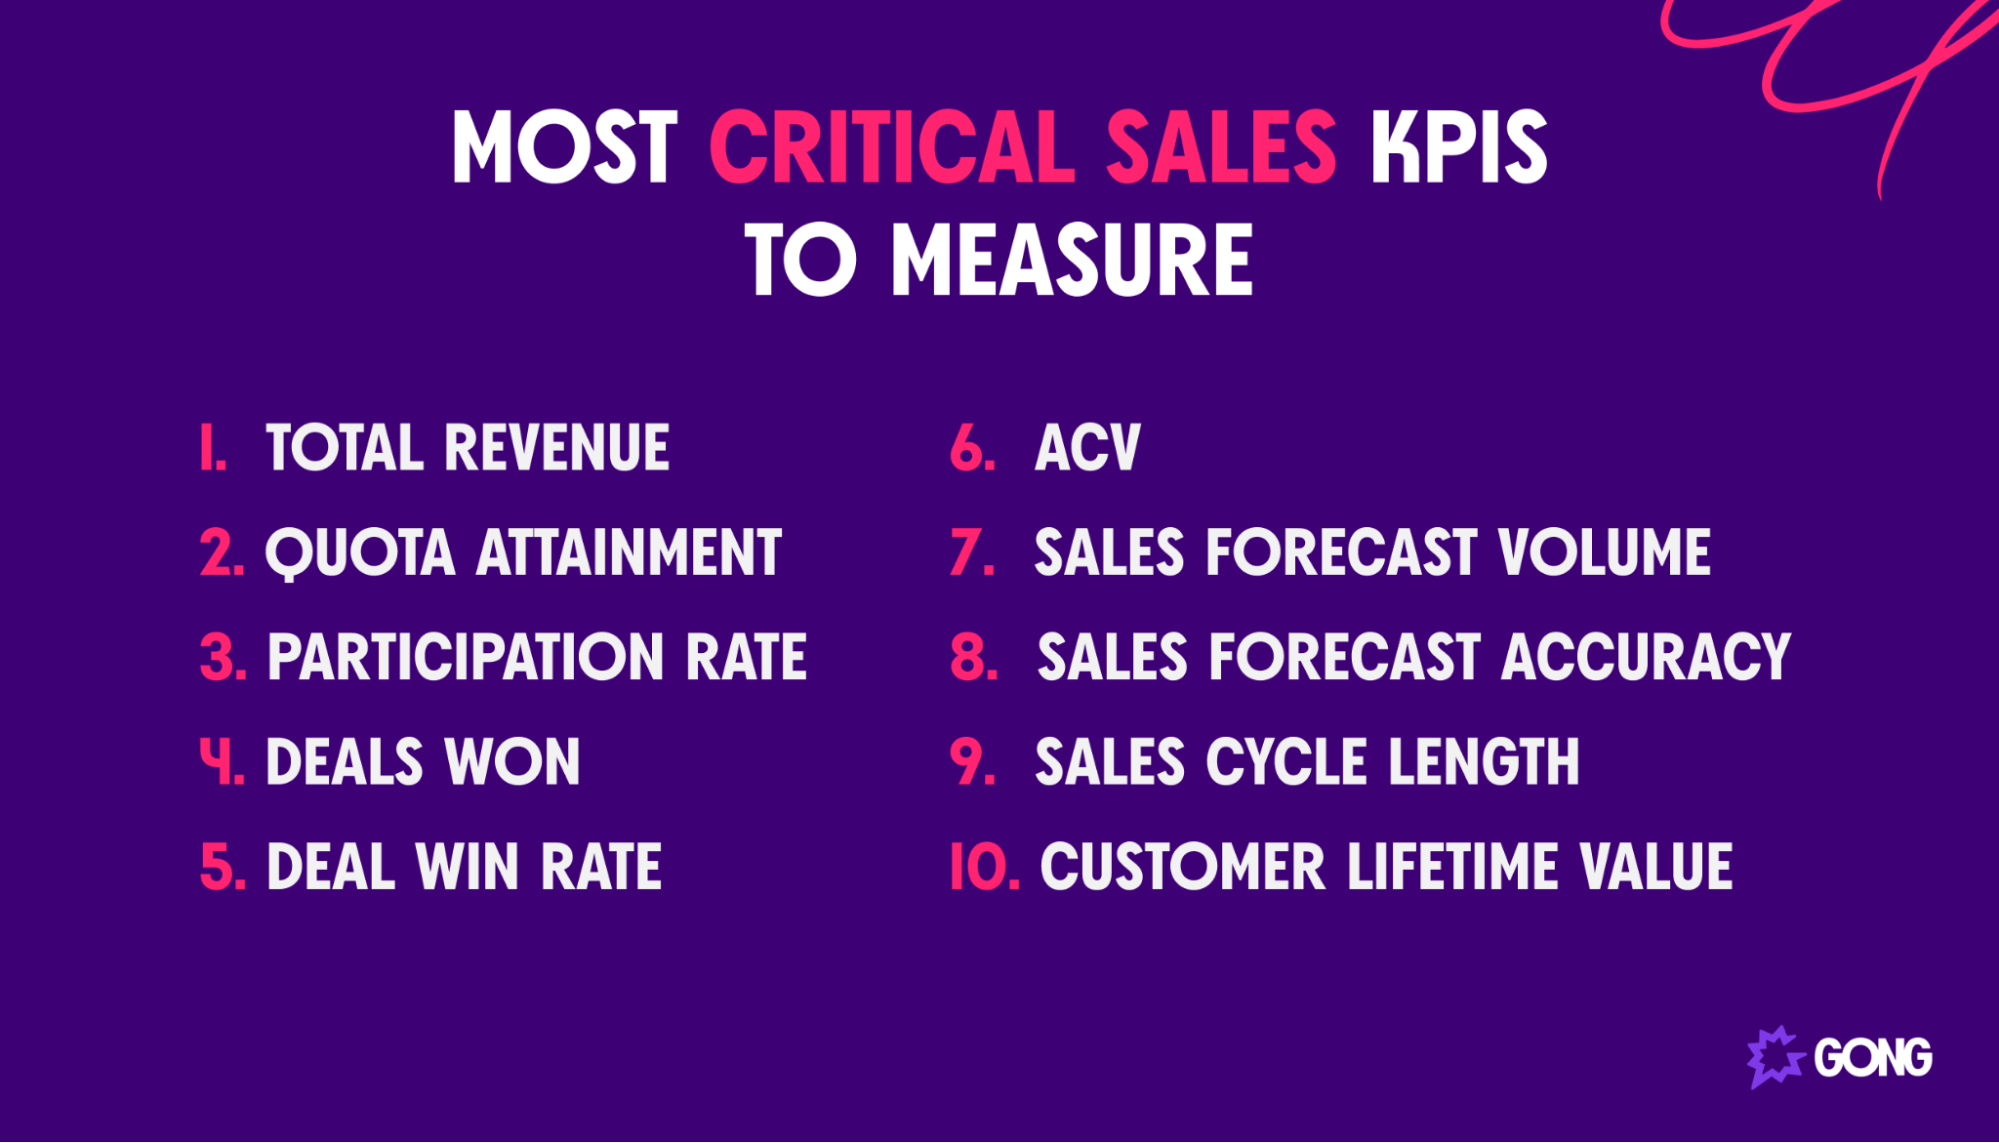
1. Total revenue
Total revenue is an obvious KPI to track; it’s ultimately what modern sales teams are working toward.
If revenue is increasing (from whichever source, be it newly acquired customers or from cross-selling opportunities), you’ll have more space to invest in expansion and internal investments.
Revenue should be tracked as a percentage of your total goal for the period.
Say you have a revenue goal of $3m this quarter. Tracking your current percentage of total revenue tells you if you’re on track. In this example, at the end of month two, you should be at 66% of your target, or $2m.
2. Quota attainment
Quota attainment is the KPI that measures whether your team has achieved or is on track to achieving their quota for a specific time period.
Quota attainment is expressed as a percentage. For example, if a team achieved half of their quota, their progress against KPI would be 50%.
To measure quota attainment, use this formula:
(Sales/sales quota) x 100
For instance, if a sales rep (yes, quota attainment can be used to measure both team and individual performance) has closed $1m in sales, and they have a sales opportunities of $3m, then the calculation would look like this:
($1m/$3m) x 100 = 33.33%
3. Participation rate
Participation rate is a sales benchmark that measures what percentage of your sales team has hit their quota.
For example, a participation rate of 80% tells you that 8 out of 10 of your sales representatives hit their target for the month.
This is an important sales metric for sales managers, as it shows you how successful your team is, as a whole.
For instance, you may hit your total quota but have a participation rate of less than 100%. This occurs when a few of your reps close much more than their quota and others fall below.
Analyzing participation rate in conjunction with your total quota attainment KPI can help identify opportunities for further coaching (and for rewarding those who’ve done exceptionally well).
4. Deals won
Deals won is a simple sales KPI: how many new sales deals did we close as won this month?
This KPI helps break large revenue numbers down into easily measurable chunks.
Say a rep’s monthly quota is $1m. You have an average deal size of $100k, meaning they’ll need to close 10 new deals to achieve their quota.
Now, they can track progress against the revenue goal, but also in terms of closed deals (and they can calculate that they’ll need to close 2 or 3 deals per week to hit this goal).
5. Deal win rate
Next to your Deals Won KPI, you should also be tracking your deal win rate , which is the percentage of deals closed as won (PS, the opposite would be your deal loss rate, but let’s try to focus on the positive).
Calculating the deal win rate is simple:
(Deals won / Total deals closed) x 100
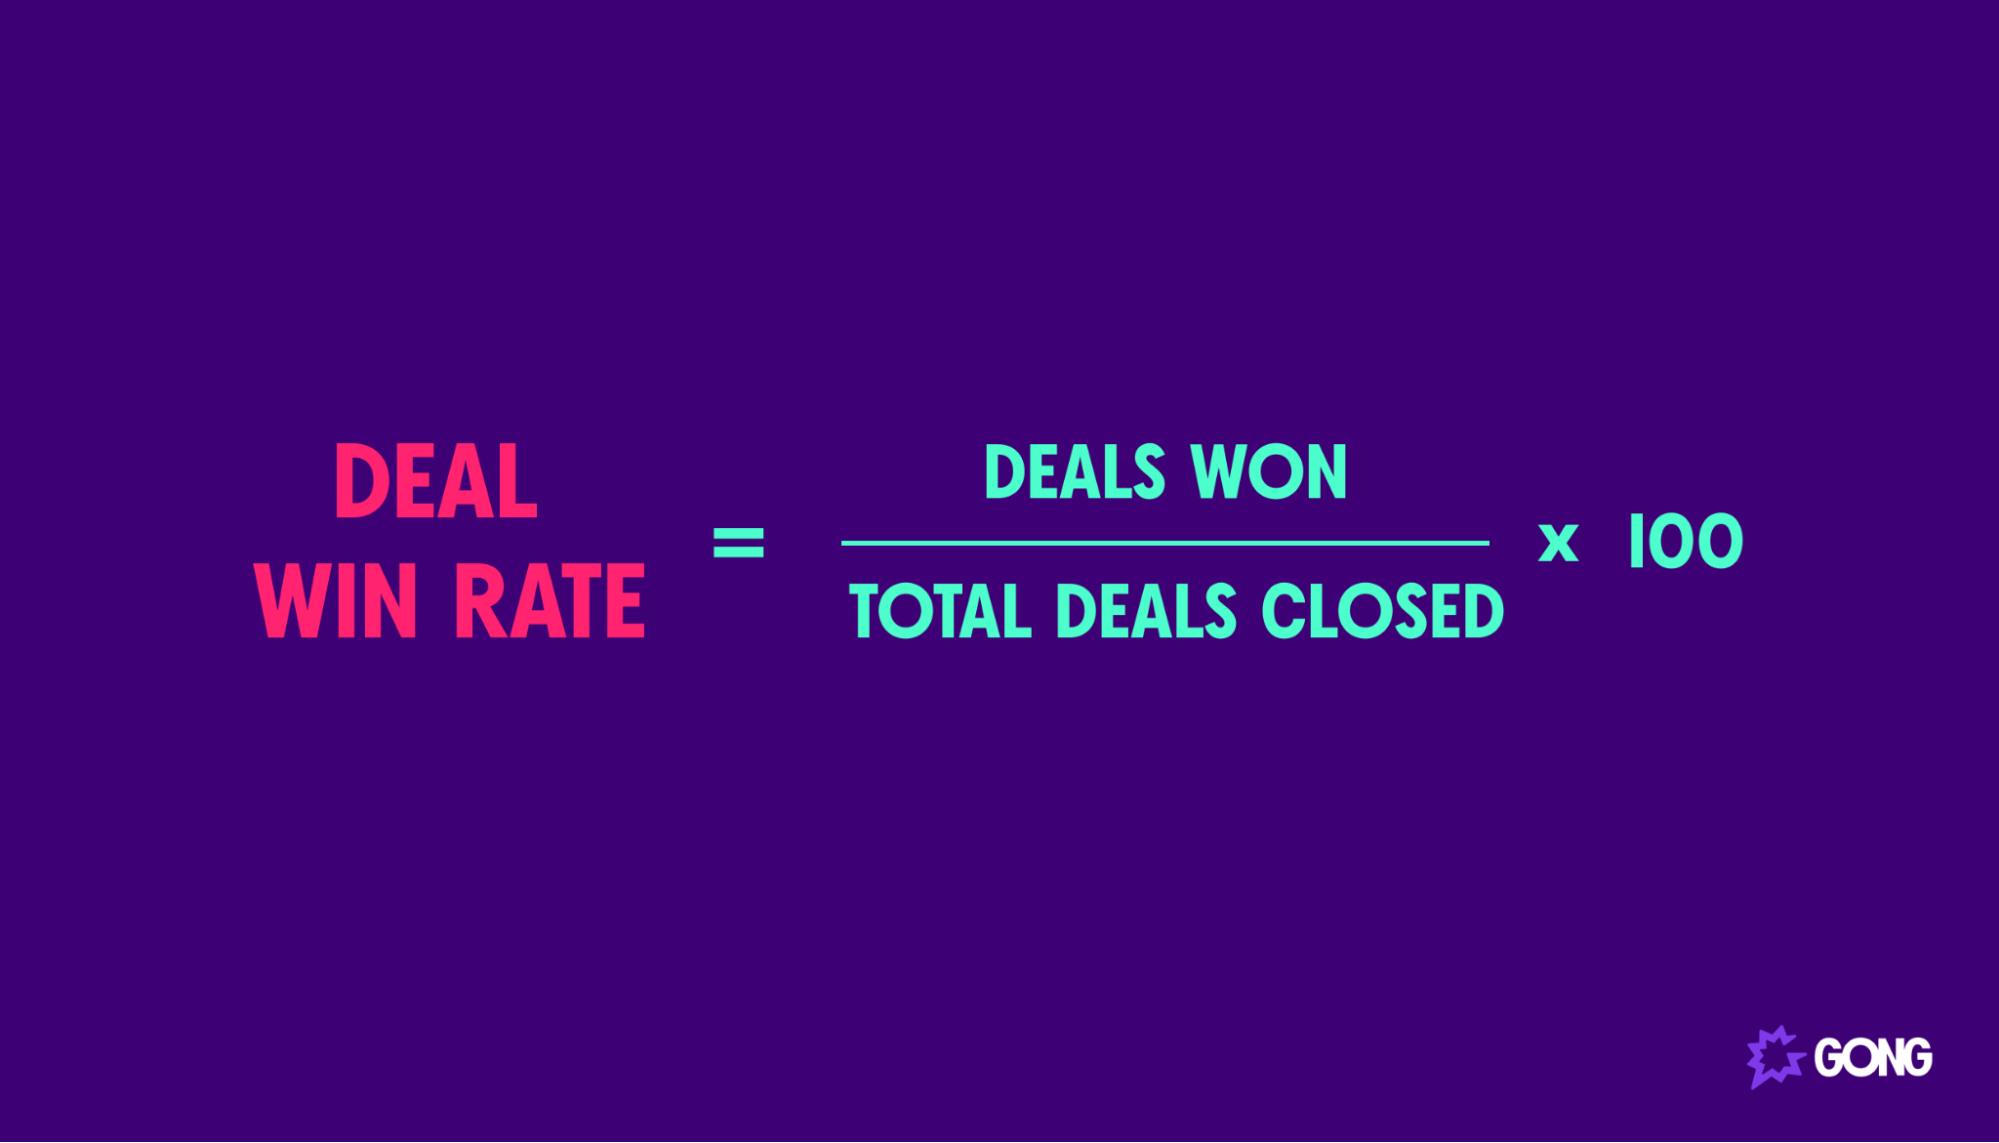
For instance, if you closed 60 opportunities this month (as either won or lost), but 40 of them were closed as won, your deal win rate formula would look like this:
(40/60) x 100 = 66.67%
Deal win rate is a great KPI for measuring the effectiveness of your sales team’s closing.
6. ACV
I told you we like our acronyms.
ACV stands for annual contract value, which is pretty easy to figure out: it’s the average annualized dollar amount of a typical contract.
This is a helpful metric as it standardizes various contracts. Some may be monthly, others for three years. Some may only include recurring revenue per customer, while others might involve one-off fees (such as implementation charges).
To calculate ACV, we take the contract’s total value (known as TCV) and divide it by the time period or the number of years per contract.
TCV / contract term in years = ACV
Let’s say, as an example, you’ve just closed a 24-month contract with a new client. They’re paying $22,000 a month, and a $12,000 data migration and implementation fee is involved.
Your total contract value, in this case, is ($22,000 x 24) + $12,000 = $540,000
To calculate ACV, we divide the TCV by the contract length in years:
$540,000 / 2 years = $270,000
7. Sales forecast volume
Forecasting future sales is a crucial activity for a number of reasons. It helps you:
- Assess whether your team is on track for meeting sales goals
- Inform senior leadership of expected revenue so they can make strategic financial decisions
- Make hiring and resourcing decisions for your team
Sales forecast volume, then, is a critical sales KPI to track.
Your sales forecast volume is essentially the sales revenue you forecast for the coming period. For instance, if you’re looking forward through the next quarter, and your forecast for that period is $4.5m, then your sales forecast volume is $4.5m.
Simple.
Then, you’ll track that against the KPI you’ve set. For instance, maybe you have a sales forecast volume KPI of $4.2m per quarter, meaning in this case, you’re doing well!
8. Sales forecast accuracy
Sales forecast volume is measured in conjunction with another important KPI: sales forecast accuracy.
That is, howaccurateare your sales forecasts?
Financial estimates are all well and good, but if your actual figures don’t look anything like your predictions, what’s the point?
Actually, it’s a little worse than that.
Imagine you forecast $1.3m in revenue for the next month. Your leadership team uses this forecast to approve investment in their marketing teams, launching a new campaign designed to drive more qualified leads through your sales pipeline.
But, only $800k comes in, leaving your company $500k short on their campaign. Not great.
Sales forecast accuracy is measured as a percentage, where 100% means your forecast was dead on.
The formula looks like this:
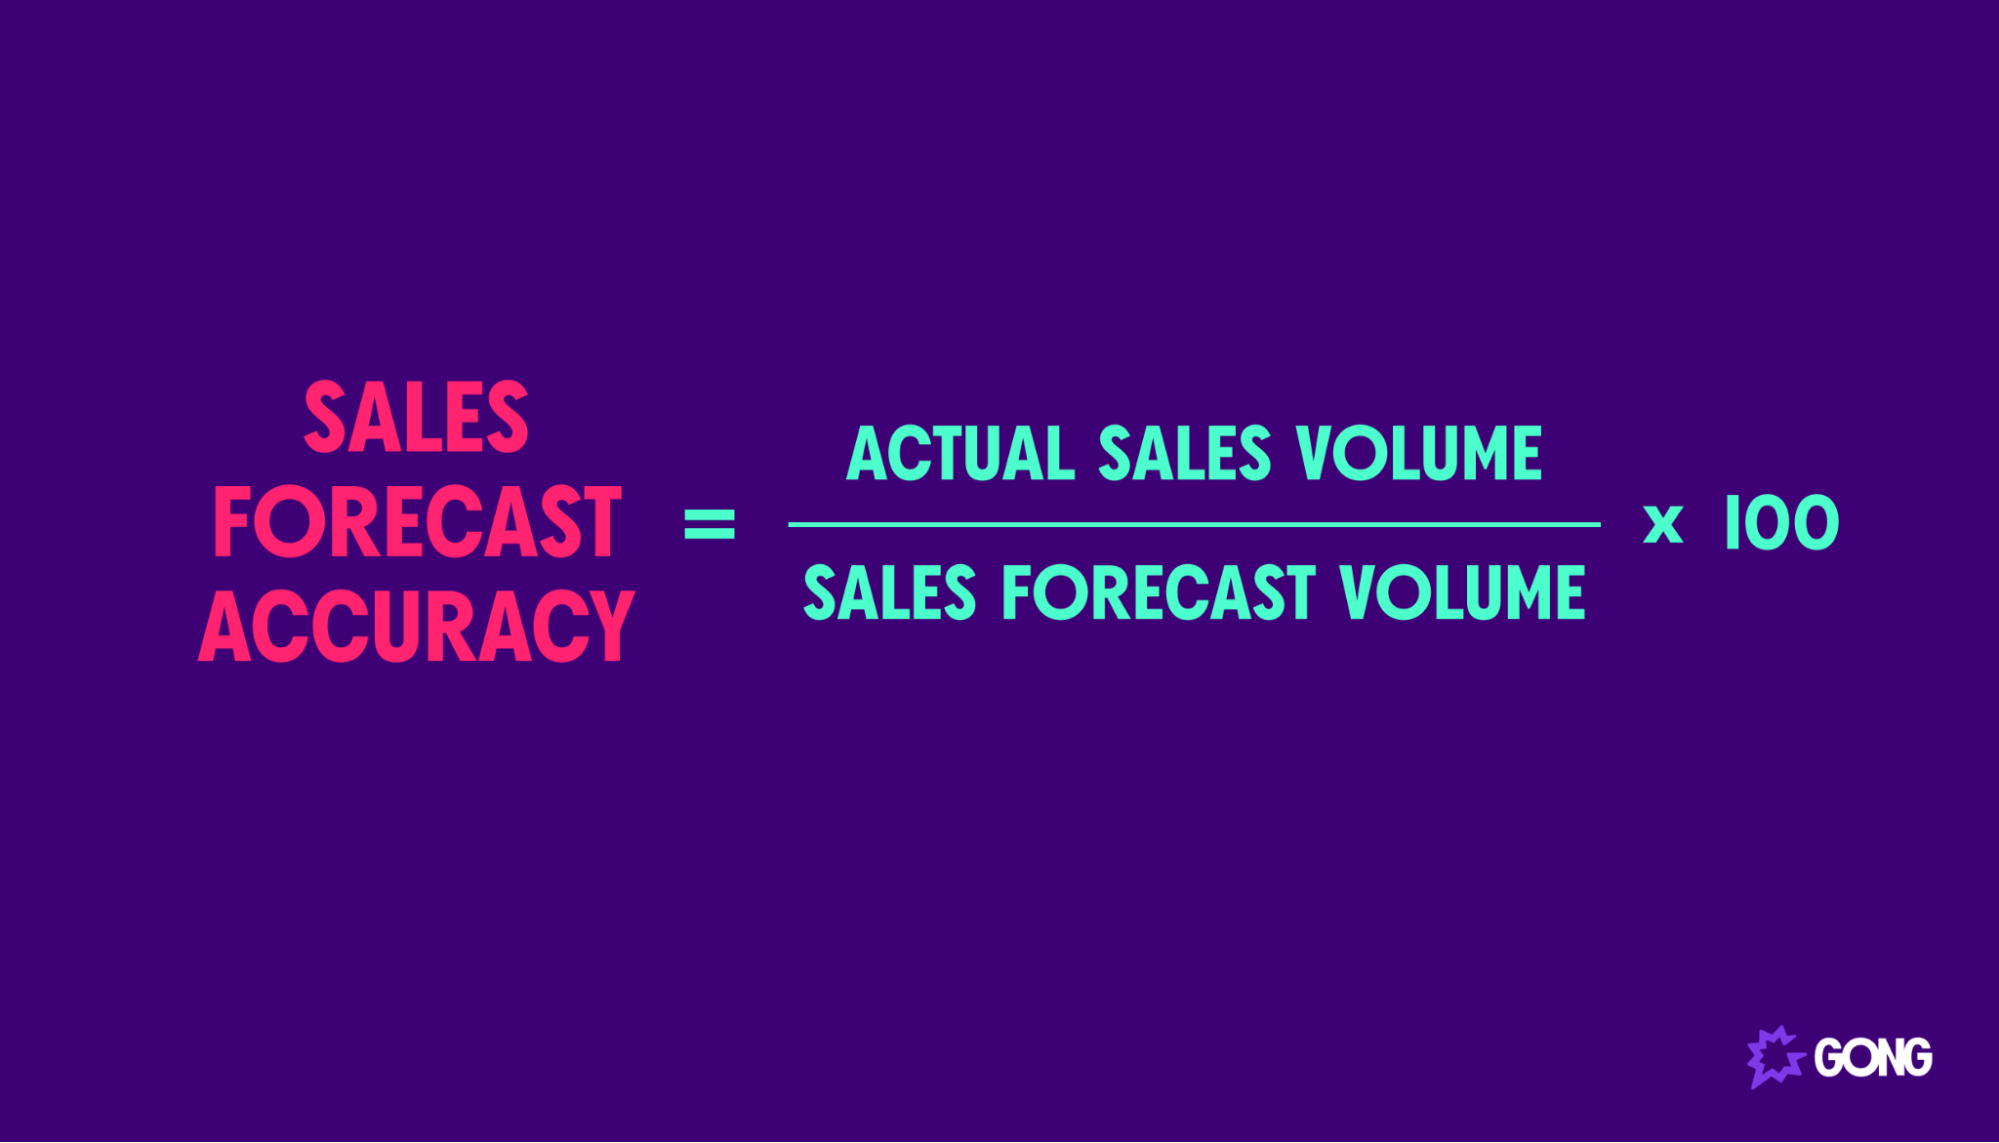
(Actual sales volume / Sales forecast volume) x 100
So, in the above example, your sales forecast accuracy calculation would be:
($800k / $1.3m) x 100 = 61.5%
Note that itispossible to obtain a sales forecast accuracy of over 100% if your actual sales end upaboveyour forecast.
In this case, however, more is not better. Even if you sell more than expected (which is nice), it still means your forecast was inaccurate. The goal here is to get as close to 100% as possible.
9. Sales cycle length
Sales cycle length is the KPI that answers the question, “How long does it take for us to close sales opportunities, on average?”
It’s measured in days and considers the time elapsed from when a new sales conversation begins through when it gets converted into qualified leads until it’s closed (either as won or lost).
Shorter sales cycles are desirable as you can close deals faster, so tracking cycle length is crucial for increasing your pace.
To calculate sales cycle length, you simply add up the total number of days each deal took to close, then divide by the number of deals measured to find the average.
10. Customer lifetime value
Customer lifetime value (CLV) is another measure of customer value.
Where ACV looks at an annualized amount, CLV measures the total amount of expected revenue over the course of doing business with an average customer. In effect, it also factors into the churn rate of your existing customers.
Your CLV calculation depends a little on your business model (ecommerce looks different from enterprise-level SaaS sales, for example). It can play a crucial role in defining your customer acquisition cost.
For subscription-based deals, the general rule is to add up the total amount of revenue received from each customer over the entire duration that the customer was active on the product (total contract value), then divide by the number of customers in that data set.
3 activity metrics to set sales KPIs for sales representatives
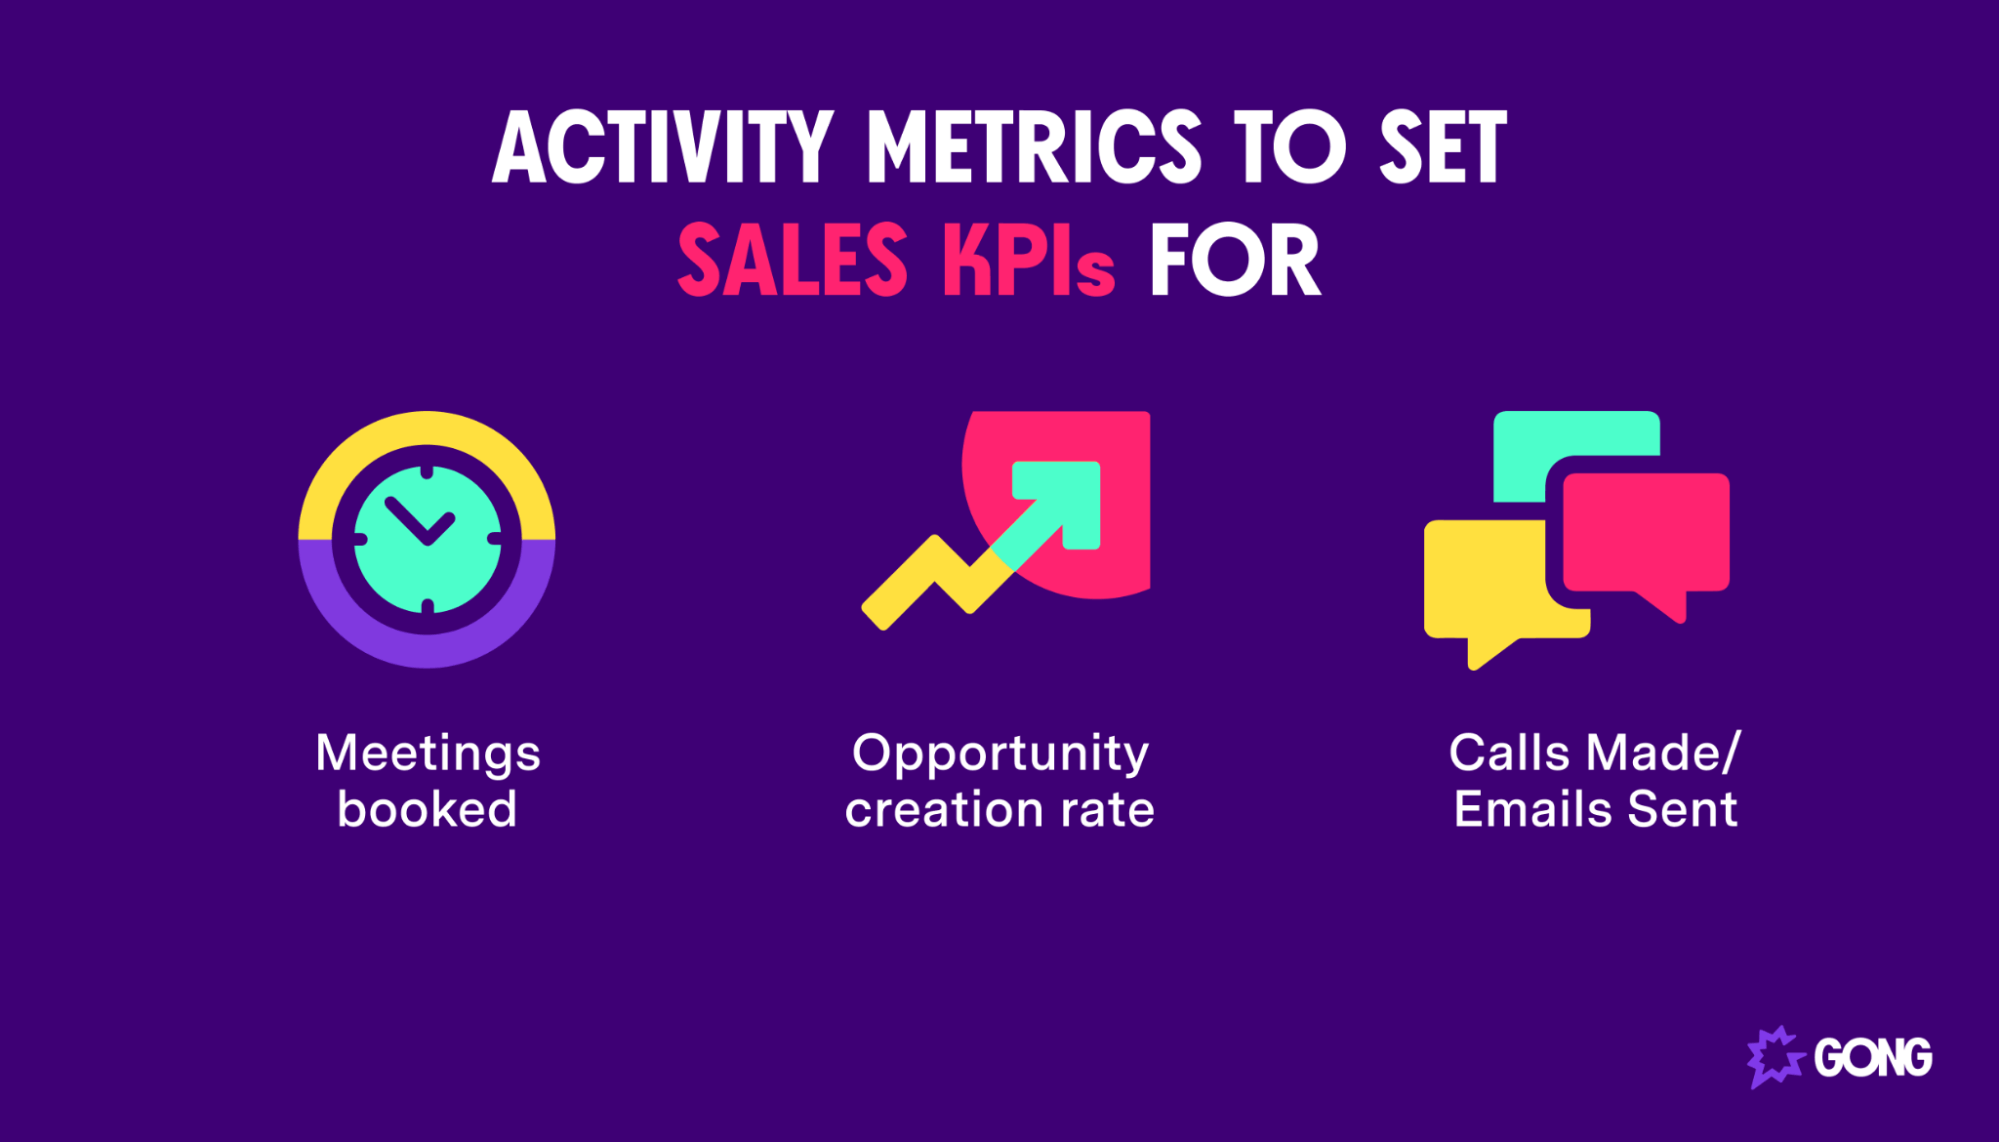
So far, we’ve looked at 10 sales KPIs that measure results. But as every great sales leader knows, results come from specific activities reps undertake to track their sales funnel.
So, to get right down to whatdrivesthose conversion rates, it’s important also to track these three activity-based sales KPIs.
1. Meetings booked
This is a simple but important KPI.
For Sales Development Reps, booking meetings (whether it’s through cold calls or cold emails ) is a crucial aspect of the role, so this needs to be measured individually and on a team level.
The Meetings Booked KPI is also often referred to as Opportunities Created, depending on your team’s terminology.
2. Opportunity creation rate
Not only do we want to measure how many sales opportunities we’ve created, but the percentage of leads we’ve turned into meetings.
How effective are our sales efforts at persuading potential customers to book a meeting?
This is called Opportunity Creation Rate, and the formula is as follows:
(Opportunities created / Total leads) x 100
3. Calls Made/Emails Sent
Your entire sales process will be built around communication, mainly through phone calls and sales emails .
So, it makes sense that we should track the most minute sales activities. After all, more calls mean more conversations, more meetings booked, and more deals closed, right?
Hit your targets and close more deals with Gong
Tracking KPIs is going to focus the attention of the entire sales team, helping you boost conversion rates, drive more leads through your sales funnel, and ultimately achieve your most important sales goals.
To access this data in real-time, however, you will need a sales tracking software platform with revenue intelligence insights built right in.
Check out how Gong’s intuitive activity data and sales pipeline management can support monthly sales growth and help improve the customer experience.
Content Author
Jonathan Costet is the Senior Director of Revenue Marketing at Wiz. Before this, he was Senior Manager, Growth Marketing at Gong, where he played a crucial role in driving demand generation through data-driven strategies. At Gong, Jonathan harnessed the power of revenue intelligence to craft effective messaging, improve customer retention, and optimize sales forecasting. He was instrumental in using Gong's platform to unlock insights that helped target the right buyers and maximize marketing efficiency.
Win more with Gong
Loading form...
Discover more from Gong
Check out the latest product information, executive insights, and selling tips and tricks, all on the Gong blog.