The Revenue Forecast Template (For Excel and Google Sheets)
Committed deals slipping? Swing deals closed lost? End of quarter surprises?
Use this revenue forecast template to forecast revenue with pinpoint accuracy, identify gaps in your sales pipeline, and maximize your win rates.
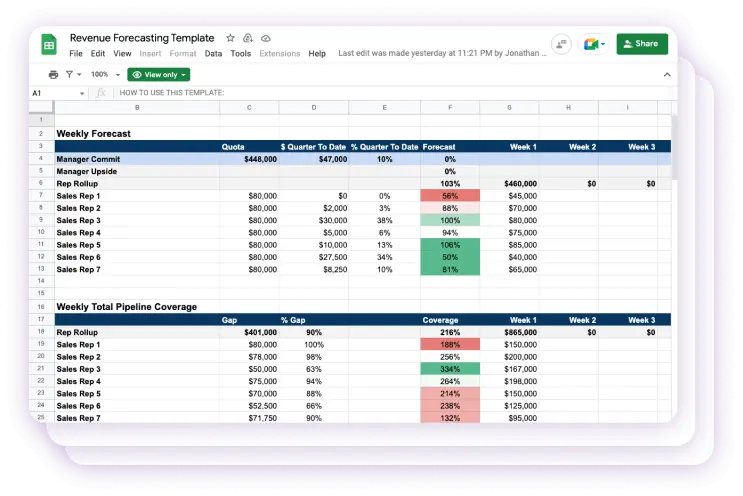
- Weekly forecastCalculate your weekly roll-up forecast for each sales rep based on their commits and information from your pipeline review.
- Measure sales performanceMeasure performance for each rep — see who’s exceeding their sales goals and who’s falling short. Then use the insights to adjust your sales strategy.
- Needed pipeline calculatorFalling behind your sales targets? Use this template to find out exactly how much pipeline your reps need to hit your quota based on average win rates over a period of time.
- Ready-to-use templatesWe did all the heavy lifting, so you don’t have to. Simply input sales figures for each rep, and the table will forecast revenue in seconds.
- For sales managersTrack performance for all sales reps and see how they’re progressing towards their targets. See weekly forecasts, pipeline coverage, and more — all from one place.
- For sales repsTrack your weekly pipeline and find missing gaps. Determine exactly how many more potential customers in your pipeline you need to hit your quarterly quota based on your average win rate.
- Weekly forecastWhether you manage 5 or 15 sales reps, you can customize this revenue forecast template to track weekly forecast figures for your entire team. The formulas are already in place, so you don’t have to create them from scratch.
- Pipeline hygieneMaintaining a “clean” pipeline ensures your reps aren’t wasting time on unqualified leads. Get a complete breakdown of your pipeline by stage to highlight pipeline hygiene.
- Sales commitsAre your sales reps delivering against their commits? Use our sales forecast template to track commits for each rep and see their actual numbers at the end of the quarter.
- Average win rateTrack average win rates for each rep to gauge their overall performance and accurately forecast expected bookings based on their pipeline.
- Weighted pipeline coverageIdentify gaps in your sales pipeline that may impact your revenue forecast. Plus, learn how much pipeline coverage you should have to meet your quota.
- Early-stage dealsSome deals can take weeks or even longer to close. See exactly how much of your pipeline is still in its early stages, so you can plan accordingly.
- Open opportunitiesDo your reps have enough pipeline coverage to hit their targets? Track open opportunities and see a sum of expected revenue for the quarter.
- Identify missing pipelineYour sales goals are almost in sight. Use the Needed Pipeline Calculator to find out exactly how much your reps should have in their pipeline to meet their quotas.
Accurately forecast revenue and align sales quotas
FAQS
A: Download the templates now and you’ll get:
- Weekly Forecast: Use this template to calculate your weekly roll up forecast number based on commits from your reps and data from your pipeline review.
- Weekly Total Pipeline Coverage: See gaps in your total pipeline that may impact your forecast. Plus, learn how much pipeline coverage you should have to meet your targets.
- Weekly Weighted Pipeline Coverage: This table breaks down the pipeline by stage, allowing you to gauge pipeline health and forecast accuracy.
- Weighted Pipeline Calculator: Enter your win probabilities here for each forecast category to get a weighted estimate of deals in your pipeline.
- Needed Pipeline Calculator: Identify missing pipeline and see exactly how much pipeline your sales rep should have to meet their numbers.
A: Here’s who can benefit from these templates:
- Sales managers: Use these templates to get your roll up forecast number and gauge the efficiency of your sales team.
- Sales reps: Review gaps in your pipeline and determine how much coverage you need to meet your sales targets.
- Decision makers: Use these sales forecasting templates to make informed budgeting, spending, and hiring decisions to support future growth.
A: You’ll be able to use these templates in Excel and Google Sheets.
A: An accurate sales forecast enables you to allocate resources and manage cash flow. Here are some tips to improve your sales forecasting:
- Review data on historical sales
- Involve your sales reps and make sure they update their sales figures
- Define your win probability rates for each forecast category
- Regularly inspect and “clean” your sales pipeline
- Keep tabs on factors that may impact forecasts (e.g., market changes, competition, etc.)
A: One method to forecast future sales is opportunity stage forecasting. Multiply the value of deals in a stage within the sales cycle by its average close rate. For example, if $100,000 worth of deals are marked as “Best Case” (with a win probability of 40%), you can expect to bring in about $40,000.
A: A sales forecasting tool enables you to make accurate sales projections based on the value of your pipeline and the likelihood of each deal to close.
- Can Machine Learning Transform Sales Forecasting? Yes, Here’s How: Learn how machine learning can transform how you forecast future revenue.
- Your CRM close date isn’t giving you the full picture. Here’s what you’re missing.: How do close dates affect your win rates? Find out in our analysis of 13,439 B2B sales opportunities.
THE BEST REVENUE FORECAST TEMPLATES
Ready-to-use templates for Excel and Google Sheets.