The complete guide to sales metrics (AKA: The 15 numbers executives care about)
Trying to manage a sales team without tracking the right sales metrics is like steering a boat without a rudder — you’ll likely end up somewhere you don’t want to be. Worse, it could lead to faulty decision-making in your sales strategy.
So, what sales metrics should you track? How can you use these metrics to inform your sales strategy and empower your sales team to achieve their goals?
In this article, we’ll explain what sales metrics are and why they’re important. We’ll also cover the metrics that you should track and provide sales metrics examples with each.
What are sales metrics?
Sales metrics are data points that enable you to measure performance across your team. They help you track progress against your revenue goals and inform your sales strategy.
By measuring the right sales metrics, sales leaders can catch early warning signs and provide guidance before it’s too late. For example, if a rep falls short of their quota, digging into their activity metrics can help you understand why.
Let’s dive into the sales metrics that you should track. We’ve broken these down into three categories: sales performance metrics, sales activity metrics, and sales pipeline metrics.
Sales performance metrics
Sales performance metrics help you measure your sales team’s overall performance. It can also help you gauge the effectiveness of your sales process.
Here’s a list of key metrics for sales performance to track.
Sales cycle length
Sales cycle length is the average time it takes to close a deal — from initial contact with a prospect to close. It’s typically measured in days or months.
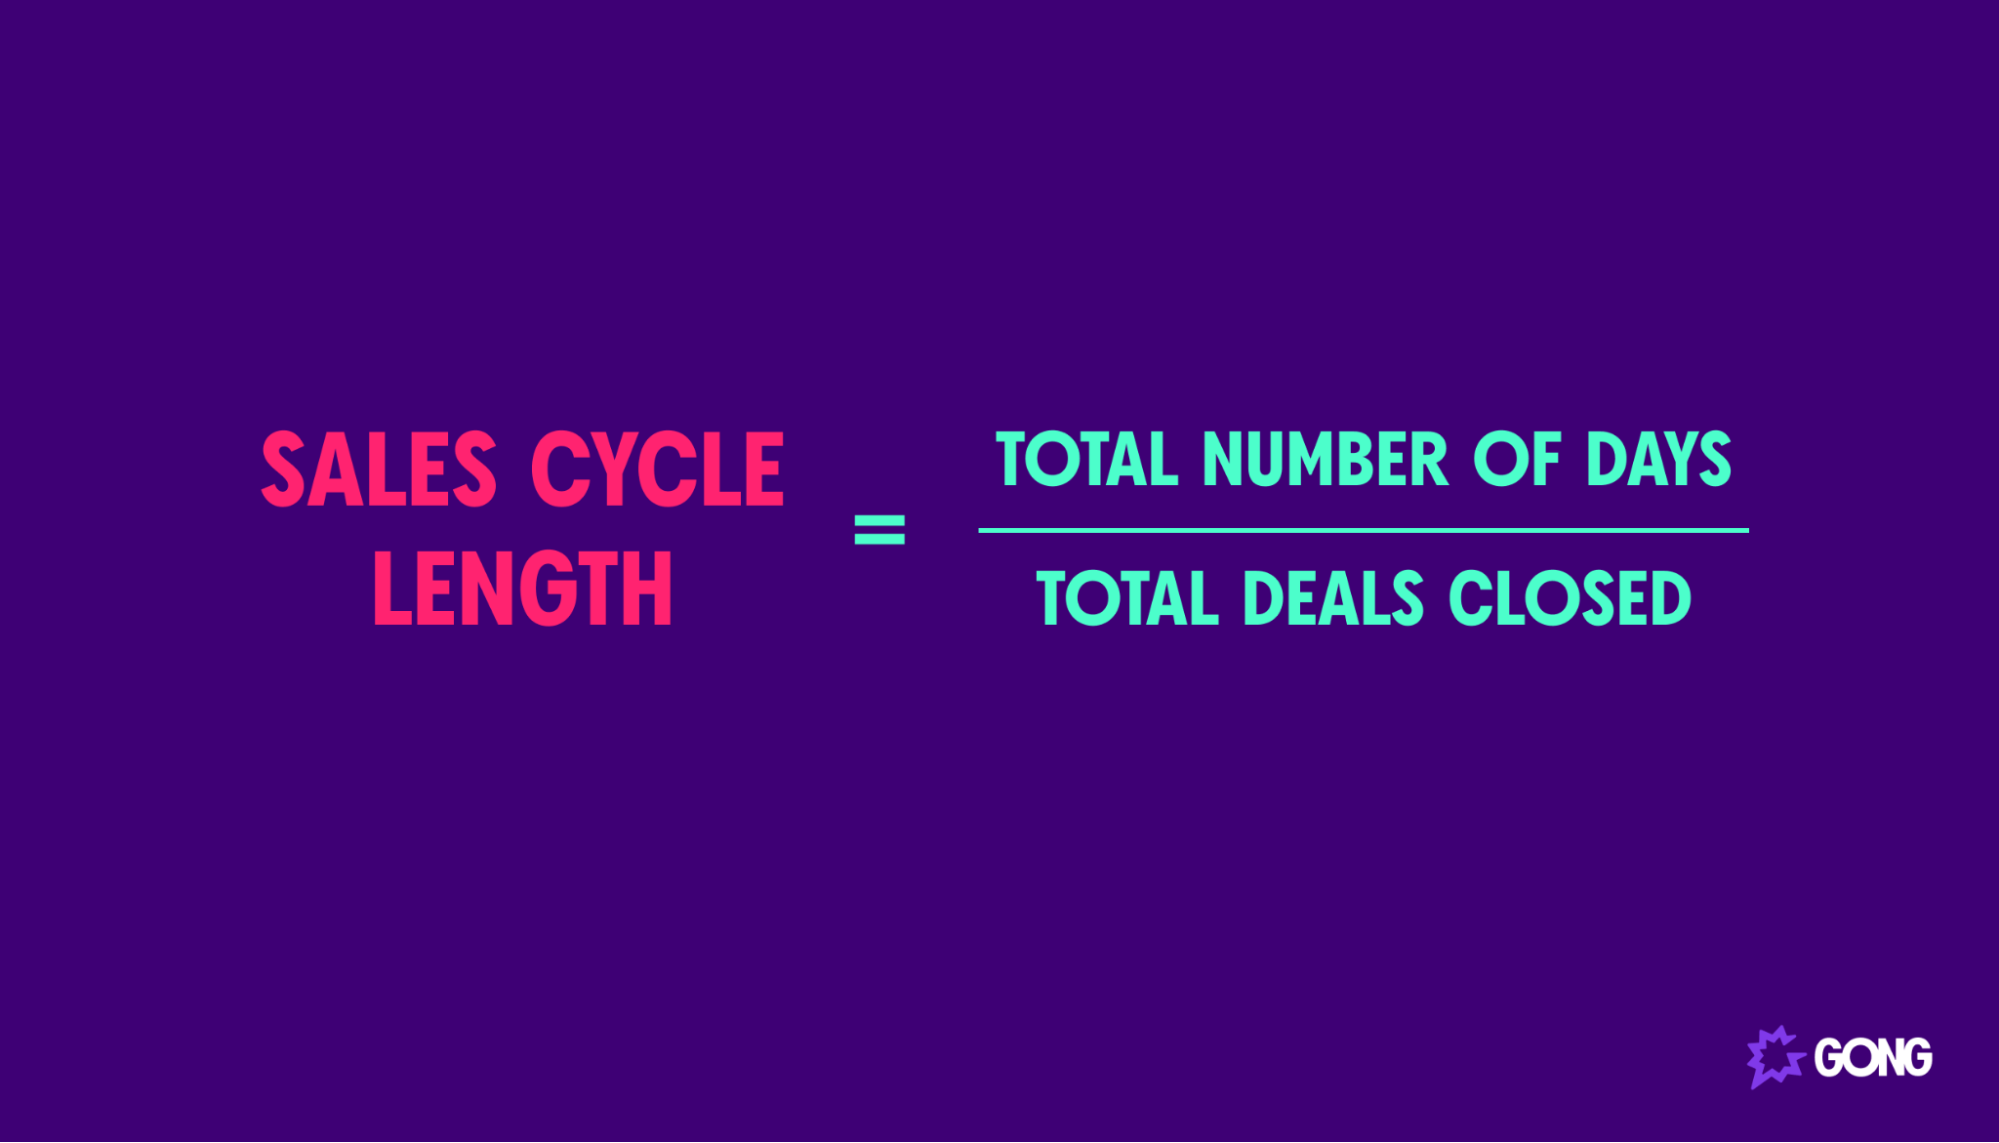
Here’s the formula to calculate sales cycle length:
- Sales cycle length = Total number of days / Total deals closed
Let’s say that a rep closes five deals:
- Deal A closes in 23 days
- Deal B closes in 10 days
- Deal C closes in 35 days
- Deal D closes in 40 days
- Deal E closes in 17 days
The total number of days to close these deals is 125. Simply divide 125 days by the number of deals (in this case, 5), and we get 25 days as the average sales cycle length.
A shorter sales cycle is ideal — the faster your reps can turn around sales, the faster the company will grow. Of course, your sales cycle length will depend on factors like your business model, target audience, and solution.
Average deal size
Average deal size is the average amount of money that your company generates on closed deals. It can help you estimate how many deals you need to close to reach a goal.
Here’s the formula to calculate the average deal size:
- Average deal size = Total sales revenue from deals / Total number of deals closed
If your reps closed 25 deals with a value of $200,000, your average deal size would be $8,000. If this value trended downward, the quality of your leads might also have decreased. Revisit your sales qualification process to focus more on higher-value prospects.
Lead-to-opportunity conversion rate
The lead-to-opportunity conversion rate is the percentage of leads that turn into an opportunity — a qualified prospect with a high probability of becoming a buyer. It helps you determine how adept your reps are at turning leads into opportunities.
Here’s the formula to calculate your lead-to-opportunity conversion rate:
- Lead-to-opportunity conversion rate = (Number of opportunities / Number of leads) x 100
If a rep turned 200 leads into opportunities, their lead-to-opportunity conversion rate would be 15%. One way to improve this metric is to have your reps ask the right number of questions.
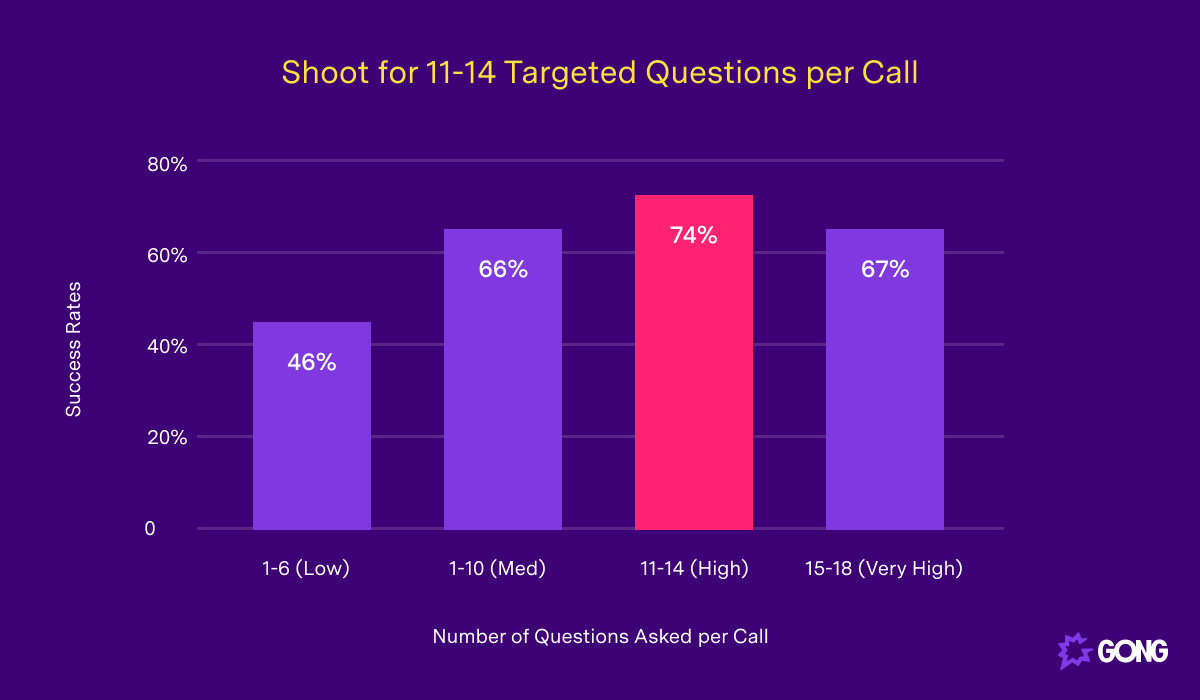
We have found the ideal number of questions to ask on discovery calls to be between 11 and 14.
Customer lifetime value (CLV)
Customer lifetime value is the average total revenue you can expect from a single buyer over their entire relationship with you.
If you’re a SaaS business, here’s how you can calculate your CLV:
- CLV = Average revenue per user (ARPU) x Average customer lifespan
If your ARPU is $4,000 and a buyer stays at your company for eight years on average, then your CLV is $32,000. A decreasing CLV indicates that your buyers are churning. Make sure to optimize your onboarding process to increase retention.
Customer acquisition cost (CAC)
Customer acquisition cost is the amount your company spends to acquire a new buyer. It helps you measure your efficiency in bringing in new business.
Here’s the formula to calculate CAC:
- Customer acquisition cost = (Cost of sales + Cost of marketing) / New customers acquired
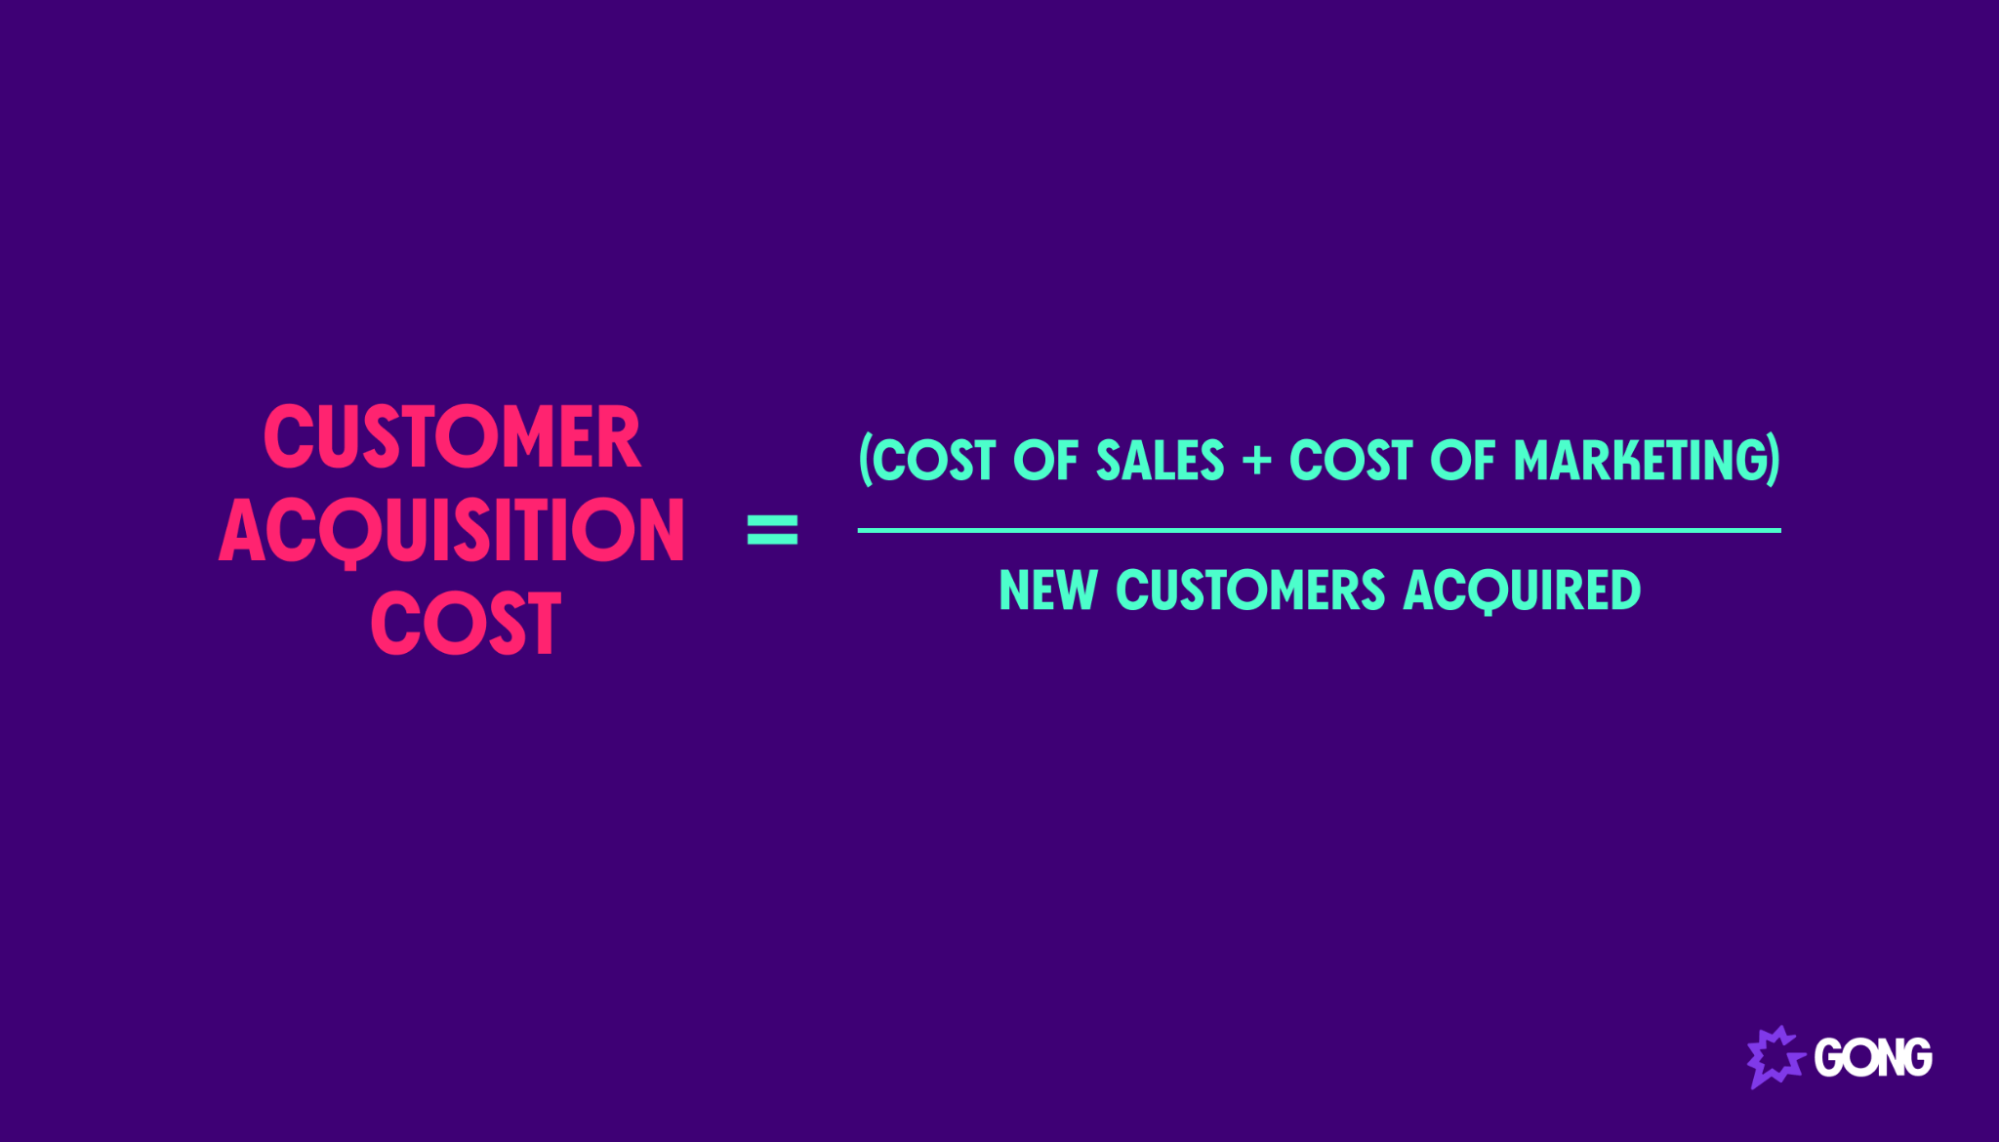
If you spend $50,000 to bring in 500 new accounts, then your CAC would be $100. If your CAC is high relative to your CLV, your sales process isn’t as efficient as it should be. It can also indicate that your sales and marketing teams aren’t properly aligned.
Monthly recurring revenue (MRR)
Monthly recurring revenue is the total predictable revenue that your company generates each month. It’s an important sales metric for subscription-based businesses, as it helps measure financial growth and assists with sales forecasting.
Here’s the formula to calculate MRR:
- MRR = Total number of accounts x ARPU
If you have 50 buyers and your monthly ARPU is $500, your MRR would be $25,000. Make sure your calculation includes recurring charges and adjustments like add-ons and discounts. Multiply your MRR by 12 to get your annual recurring revenue (ARR).
Sales activity metrics
Sales activity metrics allow you to track what your reps are doing daily. They can also help you find areas of improvement for each rep.
Here’s a look at the sales activity metrics you should track.
Number of calls made
The number of phone calls your reps make is worth tracking. Generally speaking, the more calls a rep makes, the more opportunities they can generate.
Break this metric down further by tracking:
- The number of answered calls
- The average time spent on calls
- Conversion rates
Tracking these metrics can help reps understand their benchmarks. For example, if a rep generates a new opportunity for every 20 calls they make, they can use this information to estimate how many calls they’ll need to make to meet their weekly or monthly quota.
Number of emails sent
The number of emails sent is another important metric, especially if you use cold emails in your outreach strategy.
Be sure to also track metrics like:
- Bounce rates: The percentage of email addresses that couldn’t be delivered to.
- Open rate: The percentage of recipients who opened an email.
- Response rate: The percentage of recipients who responded to an email.
These metrics can help you determine the effectiveness of your cold emailing efforts.
For example, a low open rate could indicate that your subject lines aren’t engaging. If recipients are opening your emails but not converting (i.e., booking a meeting), your CTA likely needs more work.
We have found that the best cold email CTAs ask for interest (e.g., “Are you interested in learning more about X?”).
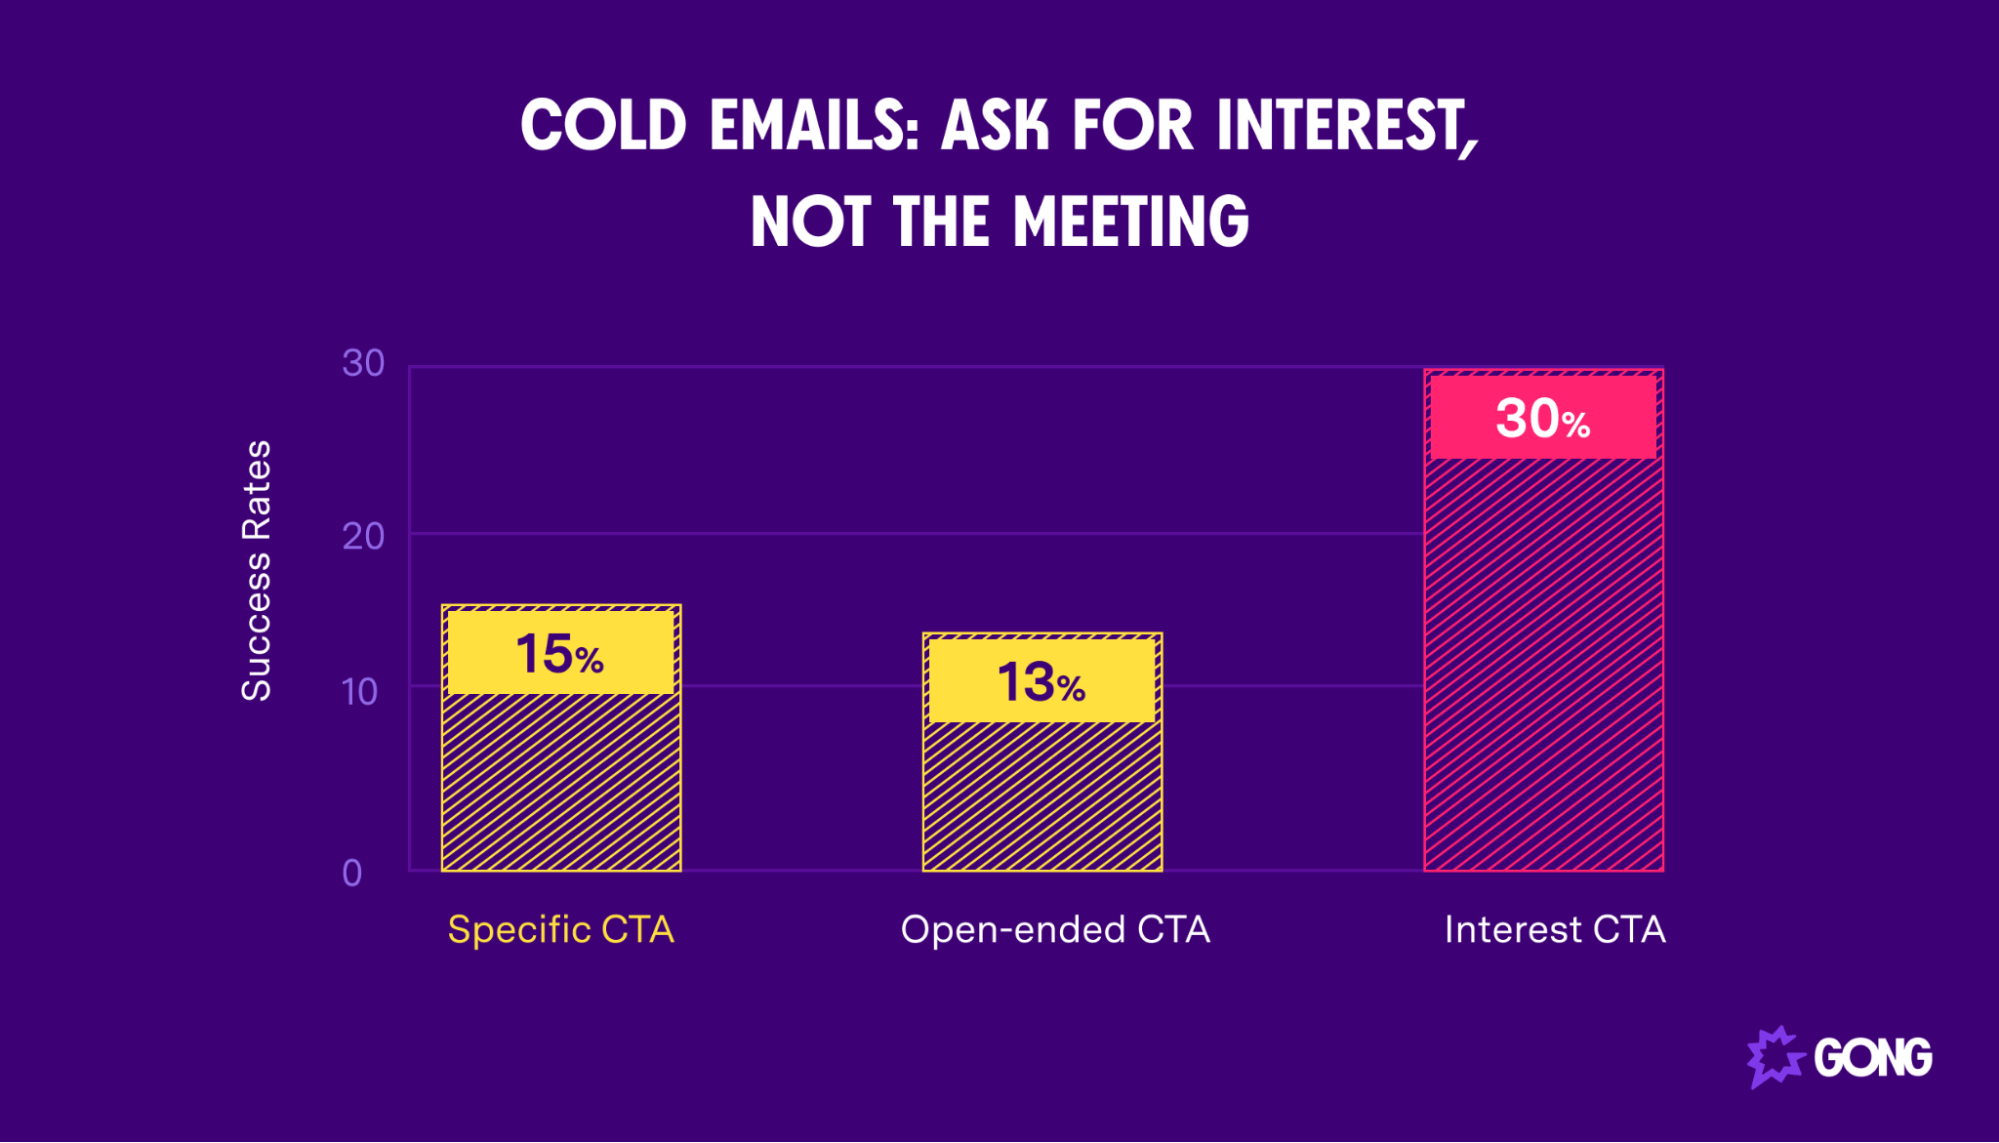
Give it a try.
If your reps are still struggling with cold email outreach, download our 7 Irresistible Cold Email Templates to learn exactly what works.
Number of meetings booked
Meetings enable your reps to learn more about each prospect. Measuring the number of meetings booked can also help you calculate your sales productivity.
Use this formula to measure how effective your reps are at booking meetings:
- Sales productivity = (Number of meetings booked / Number of calls made or emails sent) x 100
If a rep made 100 calls in a week and booked 15 meetings, their sales productivity would be 15%. Tracking the number of meetings booked can help you measure the effectiveness of new sales pitches and talk tracks.
Discovery call-to-meeting rate
Measuring your discovery call-to-meeting rate allows you to determine whether reps are conveying the value of your solution to prospects.
Here’s the formula to calculate your discovery call-to-meeting rate:
- Discovery call-to-meeting rate = (Booked meetings / Number of discovery calls ) x 100
If a sales rep made 50 discovery calls and booked 15 meetings, their discovery call-to-meeting rate would be 30%. If your reps have a low discovery call-to-meeting rate, revisit your sales messaging.
Win rate
Win rate is the percentage of deals that a rep or team closes. It provides insights into your sales strategy and indicates whether you’re targeting the right buyers.
Here’s the formula to calculate your win rate:
- Win rate = [Deals won / (Deals won + Deals lost)] x 100
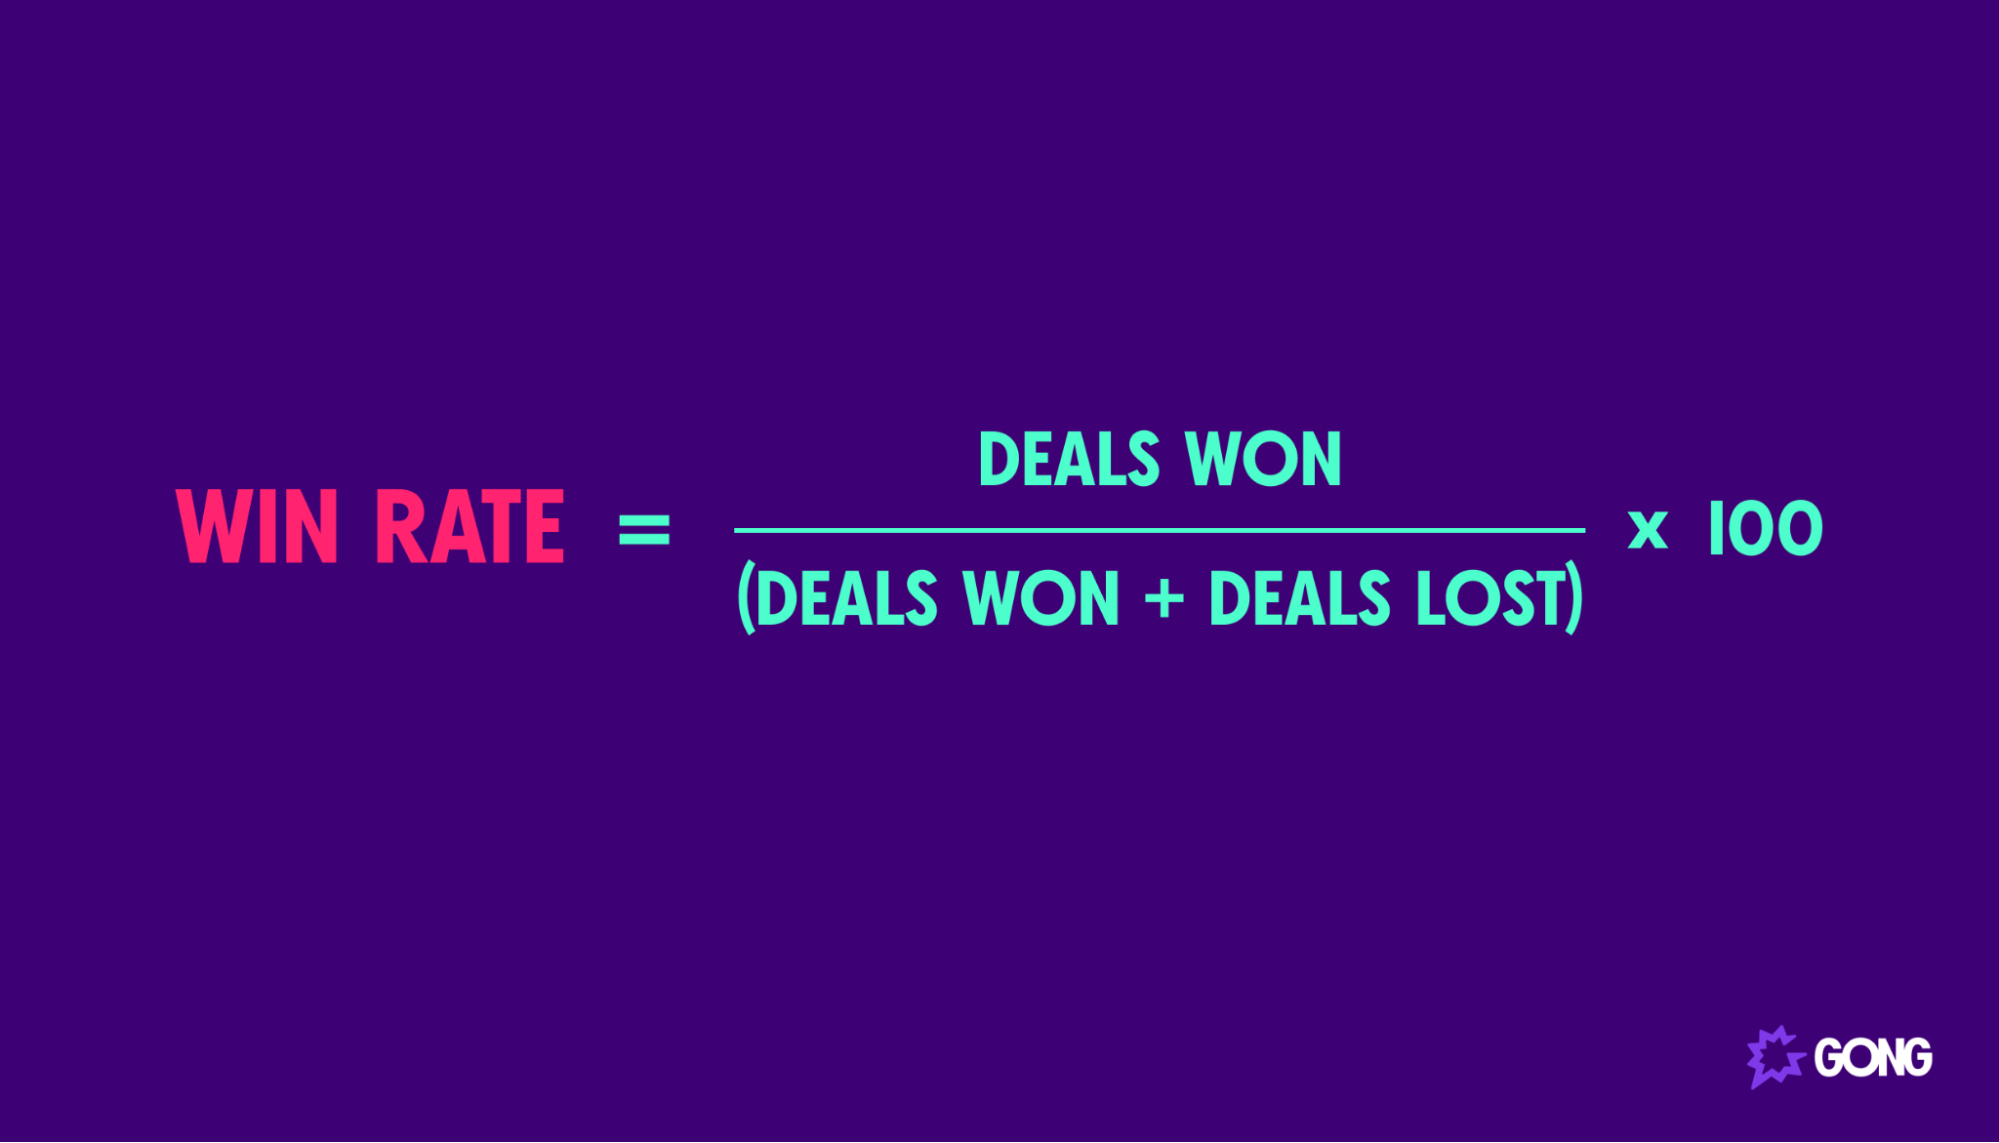
If a rep closes 10 deals out of a total of 50, then their win rate would be 20%.
Segment win rates by individual sales reps, teams, and solutions determine how each performs. If your win rates start to dip, the issue could be with your sales prospecting or something else entirely. Dive into your processes to determine where the problem is.
Sales pipeline metrics
Sales pipeline metrics help you measure your pipeline’s “health” and see how deals progress.
Track and include the sales pipeline metrics below in your sales report.
Number of opportunities
Tracking the number of opportunities your team is working with allows you to determine the health of your pipeline. It can also help you determine where to focus your sales efforts.
However, don’t just look at the total number of open opportunities. You’ll also want to calculate conversion rates by the following sales funnel stages:
- Qualification
- Discovery
- Presentation
- Alignment
- Validation
- Closing
Tracking conversion rates by stage can show you areas of improvement for each rep.
For example, a low conversion rate between the discovery and presentation stages tells you that reps need help booking meetings. Equipping them with the right sales prospecting techniques can help.
Pipeline coverage
Pipeline coverage is the ratio of the total value in your pipeline to your revenue goal. It’s typically expressed as a multiple of a sales quota.
Here’s the formula to calculate your pipeline coverage:
- Pipeline coverage = Total pipeline size / Sales target
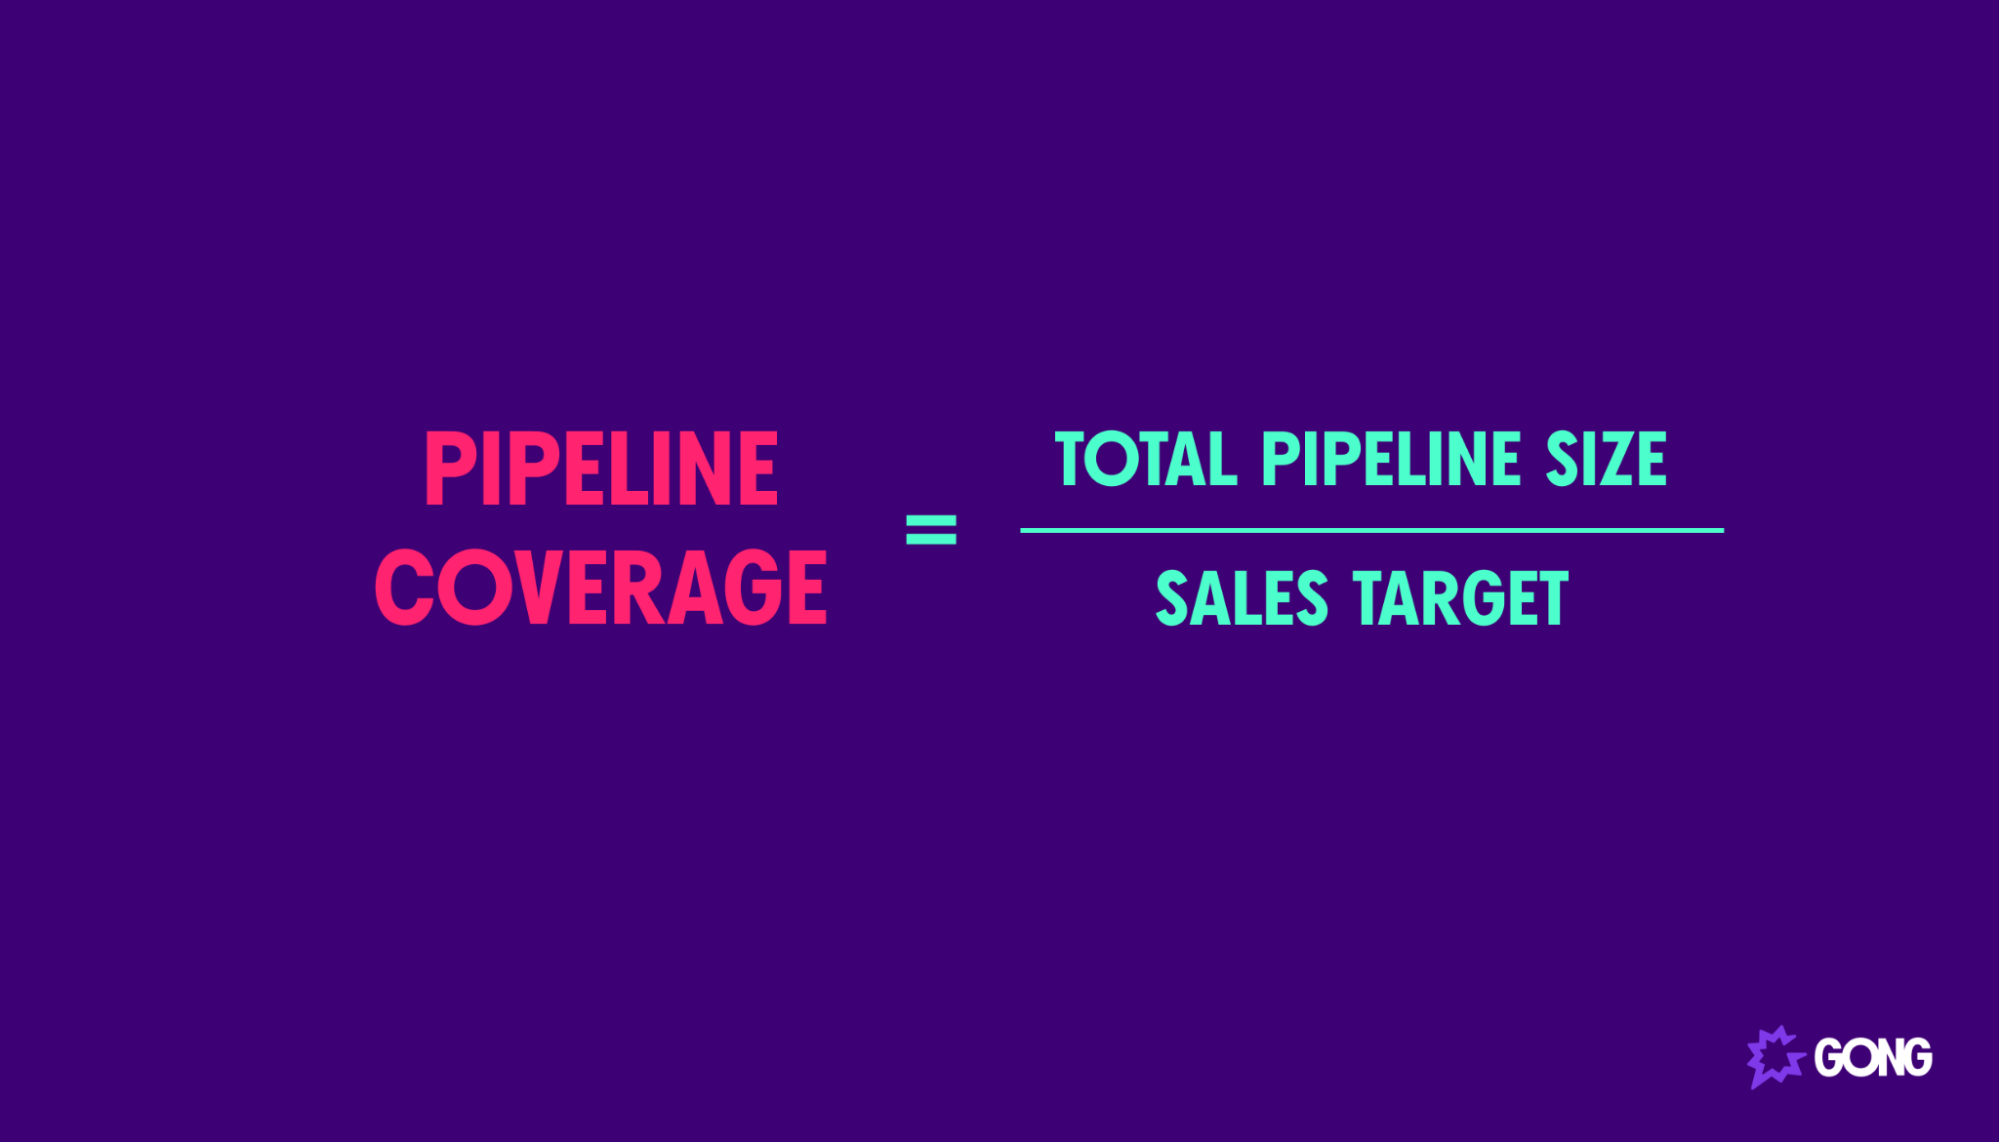
If a sales rep has $100,000 of pipeline and a quota of $50,000, their pipeline coverage would be 2x. A good rule of thumb is to have a 3–4x pipeline coverage ratio.
Participation rate
The participation rate is the percentage of sales reps who have met their targets. It helps you measure your sales team’s overall performance.
If 7 out of 10 reps hit their monthly quotas, their participation rate is 70%. Tracking this metric can tell you if you’re on track to hitting your quota as a sales manager.
Quota attainment
Quota attainment is the percentage of sales a rep closes against their quota within a given period — monthly, quarterly, or annually. Sales leaders can use this metric to create a sales forecast.
Here’s the formula to calculate your quota attainment:
- Quota attainment = (Sales from closed deals / Sales quota) x 100
If a rep closed $80,000 in deals and their quota was $100,000, their quota attainment rate would be 80%. Tracking quota attainment can help you set the right sales goals. If reps across your team aren’t hitting their quotas, you may need to adjust your targets.
How to track sales metrics
Now that you know what sales metrics to track, let’s look at how to track them.
Here are a few options:
- Spreadsheets: You can use a spreadsheet, like Excel. The good news is you don’t have to start from scratch. Download our Ultimate Sales Tracking Template — which works with both Excel and Google Sheets — to get insights into your pipeline.
- Customer relationship management (CRM) software: CRM platforms like Salesforce enable you to track different sales metrics. Many platforms provide customizable, real-time dashboards that automatically update as leads move through your sales pipeline.
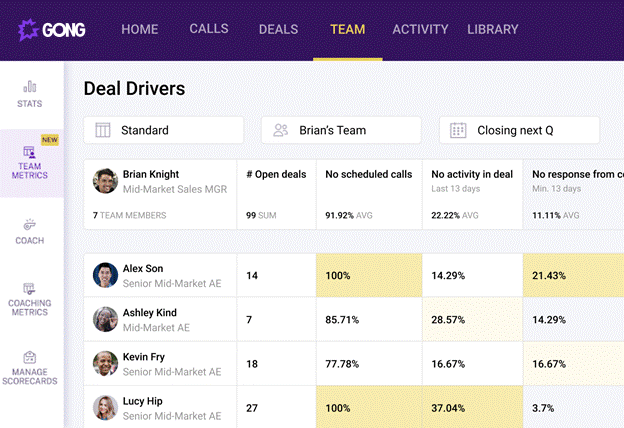
- Sales analytics software: How do you know if your reps are adopting your talk tracks? How do you know what areas they can improve in? How do you know which deals are at risk of slipping? Using sales analytics software like Gong can help you answer these questions. Plus, this software lets you track critical sales metrics, like sales activities, by rep, open opportunities, win rates, and more.
Don’t just take our word for it, though.
Learn how Tray.io used Gong to increase its win rates by 13.66% per rep.
Track your sales metrics with Gong
There’s no shortage of sales metrics. But zeroing in on the right ones can inform your sales strategy and boost your profitability. Of course, you’ll need a platform that can not only track the right metrics but also deliver actionable insights.
This is where sales analytics software comes in.
With Gong’s platform, you can capture buyer interactions across relevant sales channels and track key metrics for your team. You can also use Gong to proactively identify coaching opportunities so that you can see what areas individual reps need help with.
Get started with a demo today to see how our sales analytics software can transform your sales process and win you more deals.
