Revenue AI
The AI measurement framework: How to track the impact of investments

Bryan Bayless
VP, Revenue Center of Excellence
Published on: August 27, 2025
Last modified on: March 4, 2026

AI has officially arrived in revenue orgs. From forecasting and deal inspection to automated briefs and next-best-action nudges, AI is rapidly becoming part of every revenue workflow.
But with 87% of revenue leaders under pressure to implement AI, one big question still looms:
How do we measure the impact of our AI investments?
It’s no longer enough to say your reps are “saving time” or your teams are “more effective.” To prove the value of AI and scale it effectively, revenue leaders need to measure their return on investments (ROI) through a combination of leading and lagging indicators tied directly to business outcomes.
Here’s how to do it right.
Leading vs. lagging indicators
Before we get into the framework, it’s critical to understand the difference between leading and lagging indicators.
Leading indicators predict success. They clarify whether your organization is ready to use AI, how well your team adopts AI, and whether AI is starting to shift your targeted activities and behaviors in the right direction.
Lagging indicators, on the other hand, confirm success. These are the outputs — and ultimately, the hard business results (e.g., revenue, win rates, cycle length) — that validate whether your AI investment is paying off.
While it’s tempting to focus solely on outcomes, to truly measure revenue AI’s full impact, you need both leading and lagging indicators.
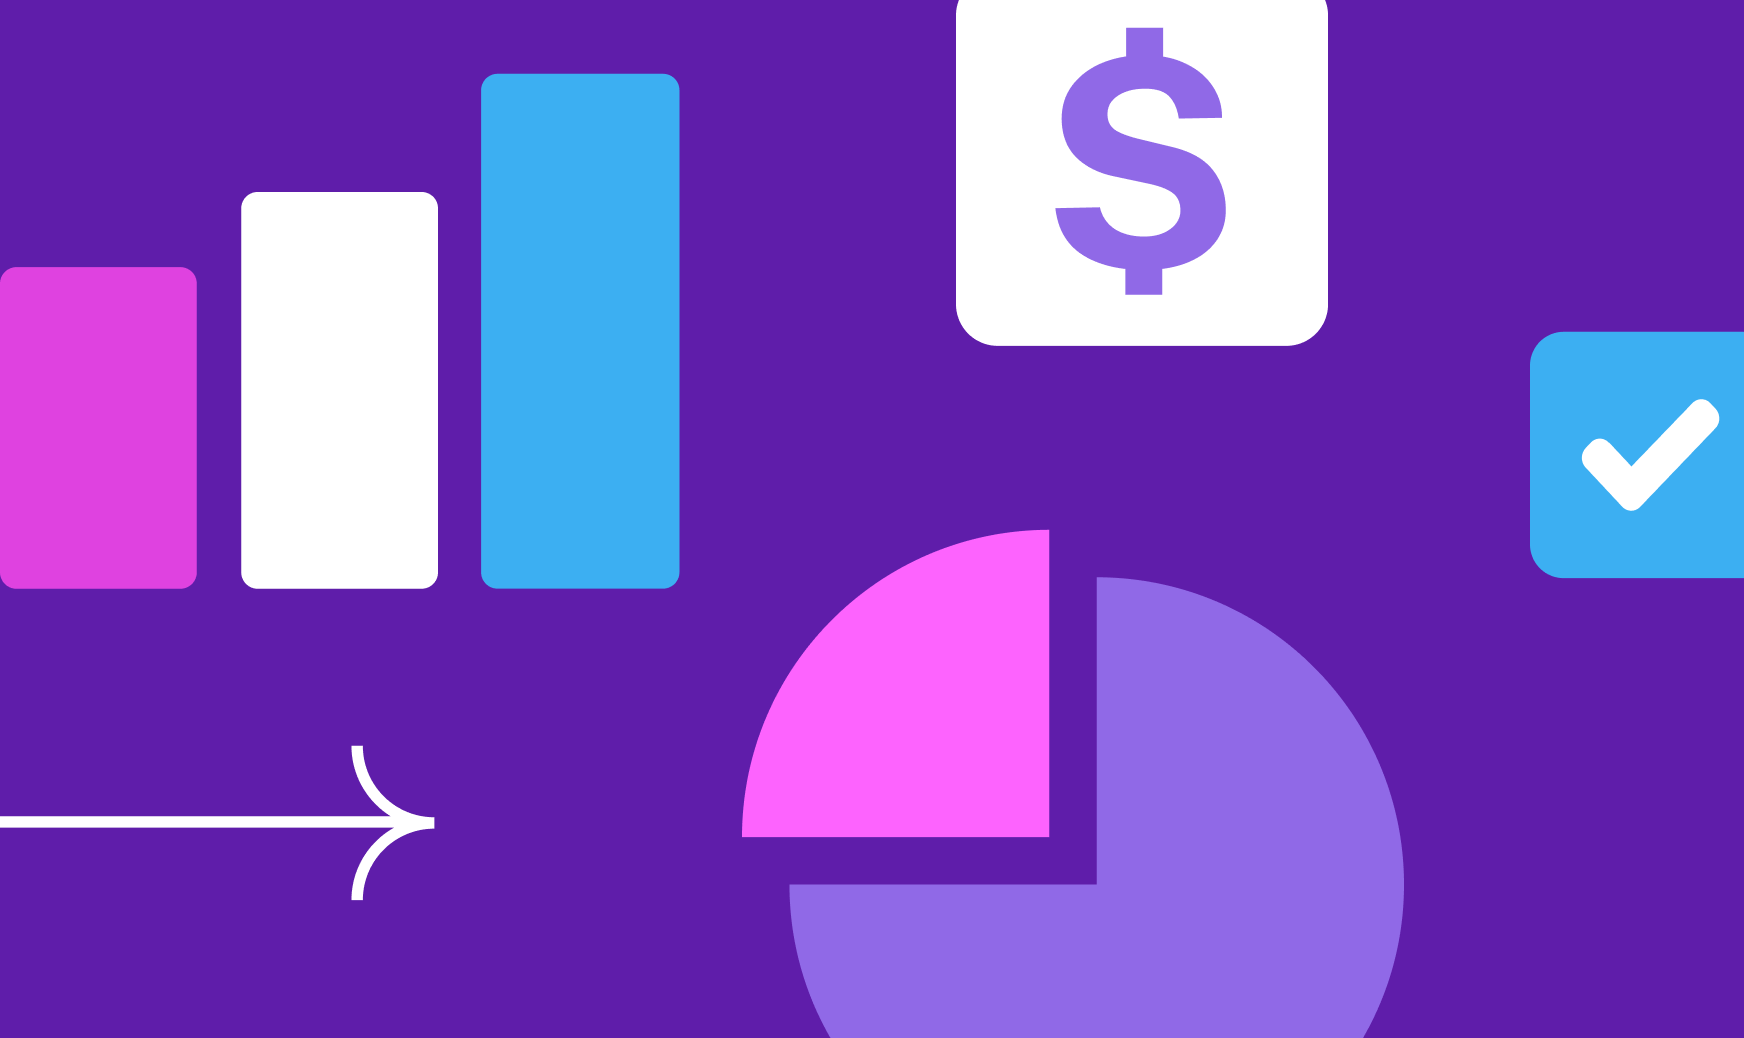
Introducing the AI measurement framework
This measurement framework tracks four categories of metrics, all of which will help you consistently monitor the success of your revenue AI initiatives from start to finish.
1. Leading indicators: AI preparedness and enablement
These metrics help determine whether your organization is ready to leverage AI effectively in its revenue operations. For example, an organization that struggles with data hygiene is almost guaranteed to get lackluster results with a new AI tool. Here are examples of metrics that indicate your team is ready for AI:
Example metric
Description
Integrations
# of go-to-market (GTM) systems integrated with AI or machine learning platforms
Data preparedness
% of clean and structured customer or revenue data available
Skill readiness
% of sales and marketing team members trained on new AI tools or workflows
Process alignment
% of AI-related GTM workflows that are documented and standardized
Governance
% of team certified on or compliant with AI guidelines and policies
2. Leading indicators: AI use and engagement
Tasks that eat up your team’s time usually point to where AI can pay off. If you see that the adoption of a particular feature is high, chances are it’s getting results in one of those areas. Below are examples of leading indicators you can use to track how often and how effectively reps use AI in their daily revenue activities:
Example metric
Description
Usage frequency
# of times an AI application is opened and used, per user, per week
Automation actions
# of tasks automated via AI, per user, per week (e.g., meeting summaries, lead scoring)
Prompting volume
# of generative AI prompts written
Feature adoption
% adoption of new AI-powered features/functions
3. Lagging indicators: Tangible results of AI activities
These are the near-term outputs tied directly to your AI-enabled activities. These could be efficiency metrics like time savings or increased capacity, or effectiveness metrics like improved lead quality or forecast accuracy. They emerge as the first category of lagging indicators:
Example metric
Description
Seller capacity
# of new opportunities worked by each rep
Lead quality
% improvement in qualified lead prediction accuracy
Forecast precision
% improvement in pipeline forecast accuracy
Initiative adherence
% of the team adhering to new initiatives, whether that’s for messaging, sales process, etc.
Seller response time
% reduction in time it takes reps to respond to buyer inquiries, follow up, etc.
Time savings
# of hours saved by using AI
4. Lagging indicators: Business impact of AI
These data points are what you usually see highlighted on AI providers’ websites and in their customer stories. They reflect the high-level, longer-term value AI can bring to your business. As a revenue leader, these are ultimately the metrics you’ll be on the hook for:
Example metric
Description
Average deal size increase
$ increase in deals where AI identifies upsell or cross-sell opportunities
Win rate increase
% change in win rates for deals where AI recommendations were used
Cost efficiency
Reduction in cost per lead, CAC, cost to support, etc.
Cycle time reduction
Decrease in average sales cycle duration due to AI insights
Customer retention
% increase in renewals or upsells driven by AI-powered insights
Qualitative wins matter too
Not every AI benefit will show up in this framework or on a dashboard. That’s why it’s important to pay attention to qualitative wins too, like these:
- Reps feeling more confident and prepared for calls
- Increased time savings that reduce burnout across the team
- Managers spending less time gathering context and more time coaching, leading to a better culture of team development
- Selling teams feeling more aligned, and execs jumping into deals without scrambling for info
Ultimately, these are all signs that AI is creating a higher-functioning, more connected revenue team.
Ready to measure your AI’s ROI?
AI isn’t magic. It only delivers ROI when it’s properly configured, adopted, embedded into workflows, and tied to measurable outcomes.
For CROs, RevOps leaders, and GTM teams, the path to unlocking the value of revenue AI is clear:
- Start with a solid foundation of AI-ready data and integrated systems
- Monitor adoption and workflow engagement across teams
- Track time savings and activity execution
- Report on lagging outcomes like win rate, cycle time, and revenue
When you deploy AI strategically and measure it rigorously, it not only speeds up your team but also makes your entire revenue engine smarter.
Ready to start your journey with the Gong Revenue AI Platform? Let’s talk.
VP, Revenue Center of Excellence
Bryan Bayless is a seasoned revenue operations executive with over 20 years of experience leading operations, finance, and go-to-market strategy for B2B technology companies.
He specializes in operational efficiency, AI-driven revenue intelligence, and data-informed decision-making, helping organizations scale growth and align teams around measurable business outcomes.
Win more with Gong
Loading form...
Discover more from Gong
Check out the latest product information, executive insights, and selling tips and tricks, all on the Gong blog.